“I help industries achieve smart manufacturing through scalable Industrial Automation & IIoT solutions. From PLC programming to cloud-connected dashboards, I design systems that run reliably and securely. By bridging the gap between shop-floor operations and enterprise systems, I enable data-driven decision making, improved efficiency, and future-ready digital transformation.”
I am a Dynamic and Results-Driven Senior Project Engineer with over a decade of experience (10+ years) in the field of Industrial Automation, Process Control Systems, and IIoT-driven Smart Manufacturing.
Played a pivotal role in designing, implementing, and commissioning automation and digitalization projects across pharmaceutical, glass, dairy, and process manufacturing.
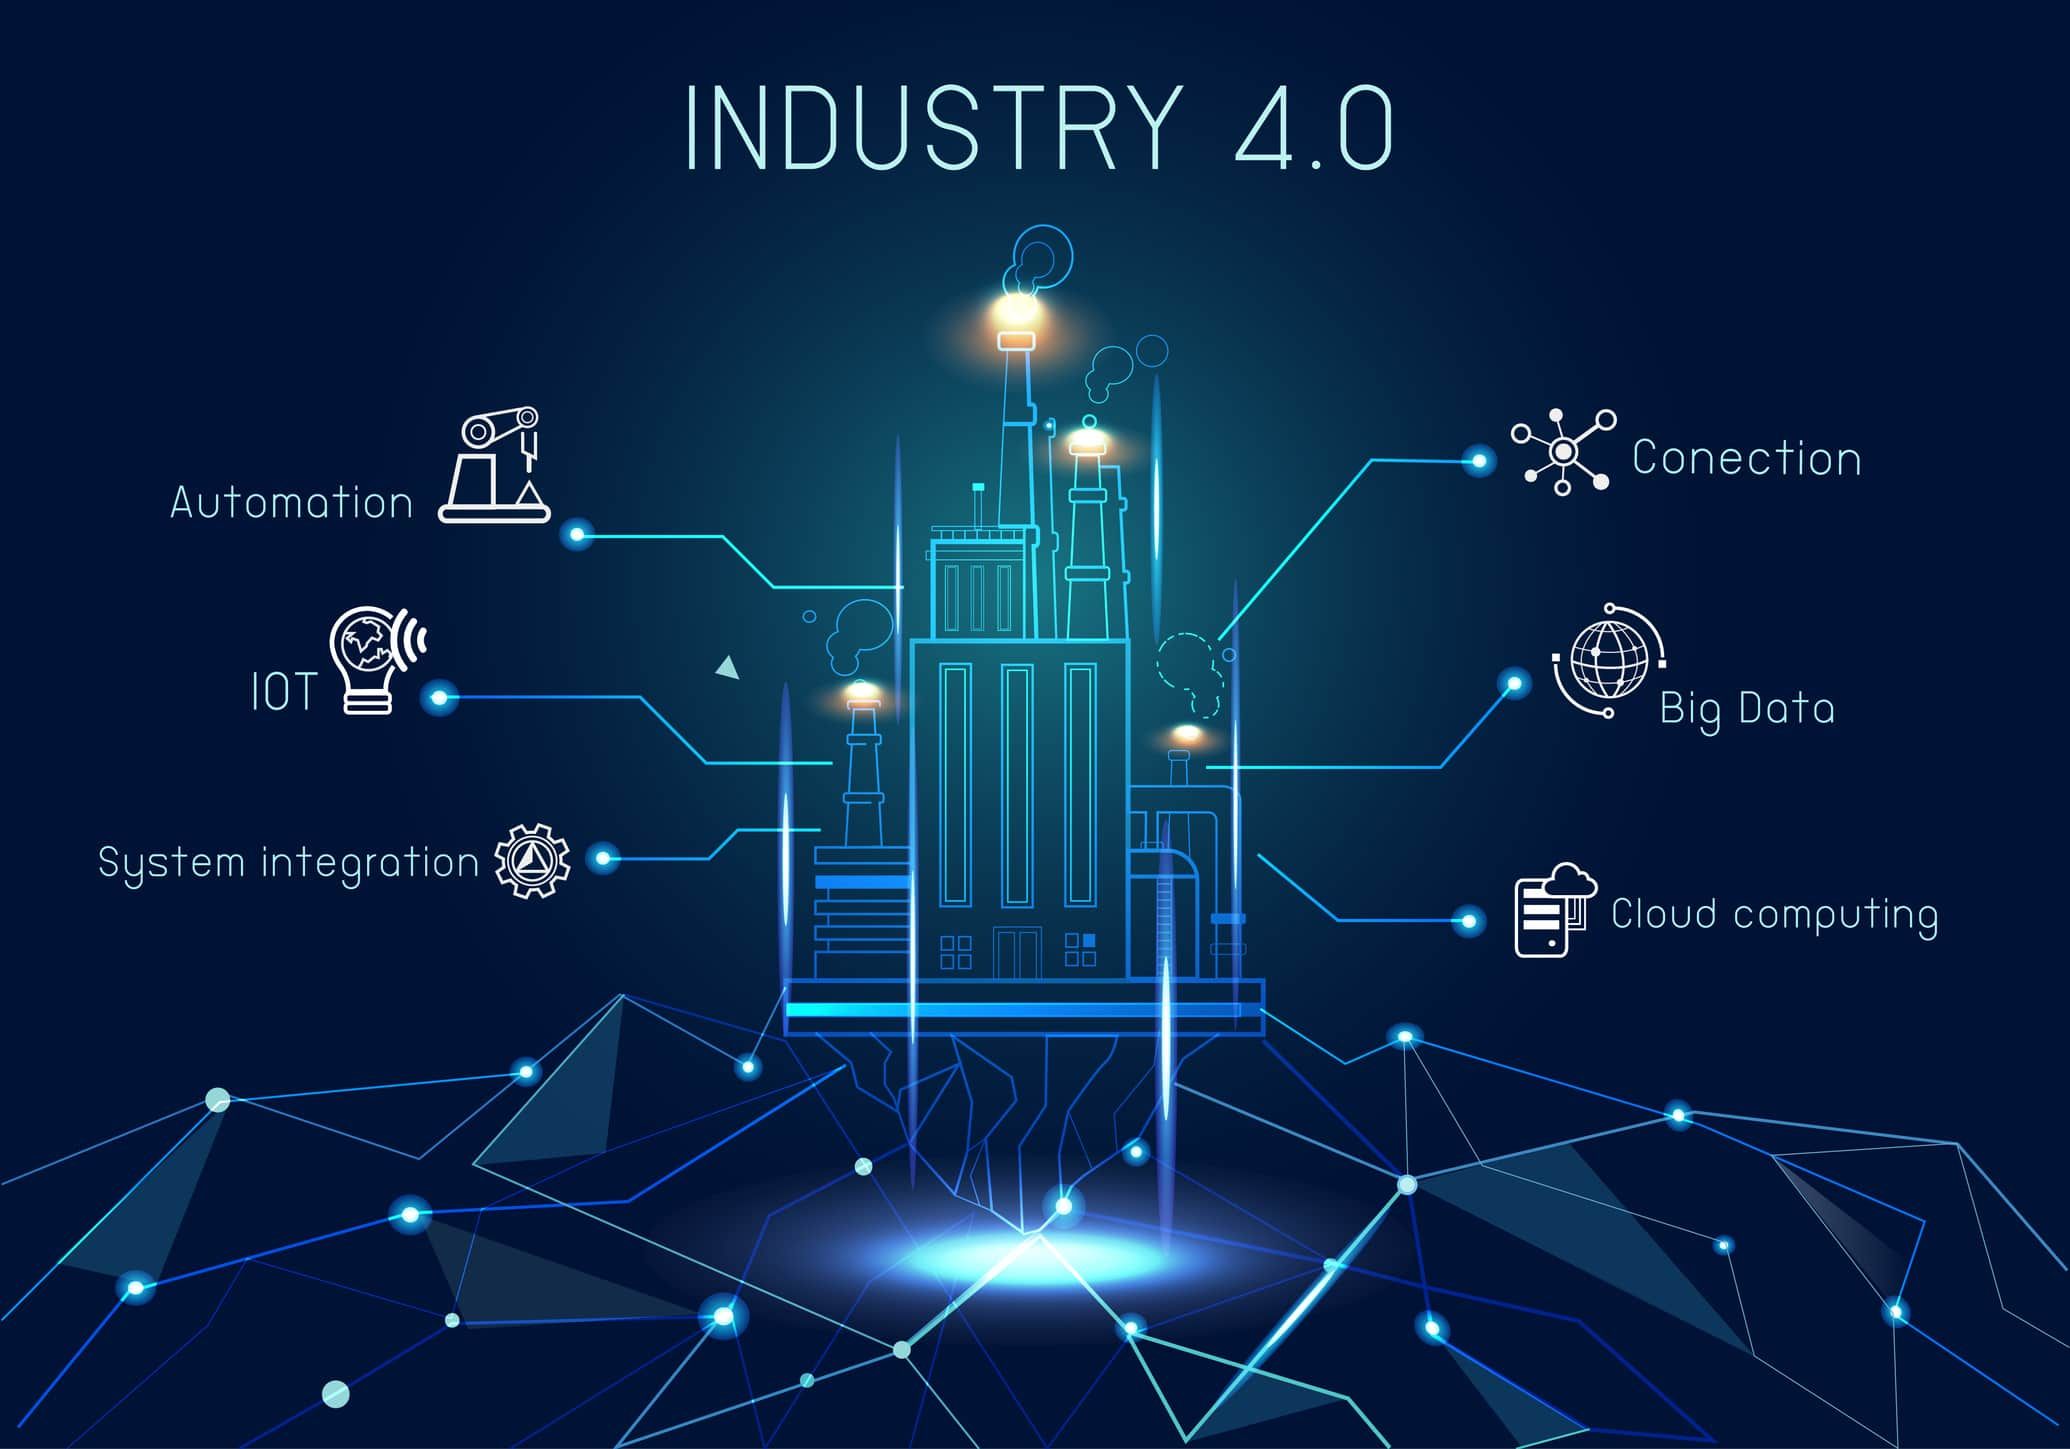
Passionate about technology-driven transformation — enabling industries to move toward Industry 4.0, Smart Factories, and Digital Manufacturing ecosystems.
Specialize in solutions that automate processes and create actionable insights, operational efficiency, and business intelligence through advanced connectivity and data integration.
🛠️Core Automation Expertise
Rockwell Automation Systems:
PlantPAx Distributed Control System (DCS)
ControlLogix & CompactLogix PLCs
FactoryTalk View SE/ME (SCADA, HMI systems)
FactoryTalk Historian for centralized data management
End-to-end redundant system design for maximum availability
Distributed SCADA architectures with seamless failover handling
Communication Protocols:
Expertise in Ethernet/IP, Modbus TCP/RTU, OPC DA/UA
Integration of legacy and modern PLC/DCS systems into a single connected ecosystem
Designing interoperable communication bridges for vendor-agnostic systems
SQL Database & Reporting:
Real-time data transfer from Historian to SQL Databases
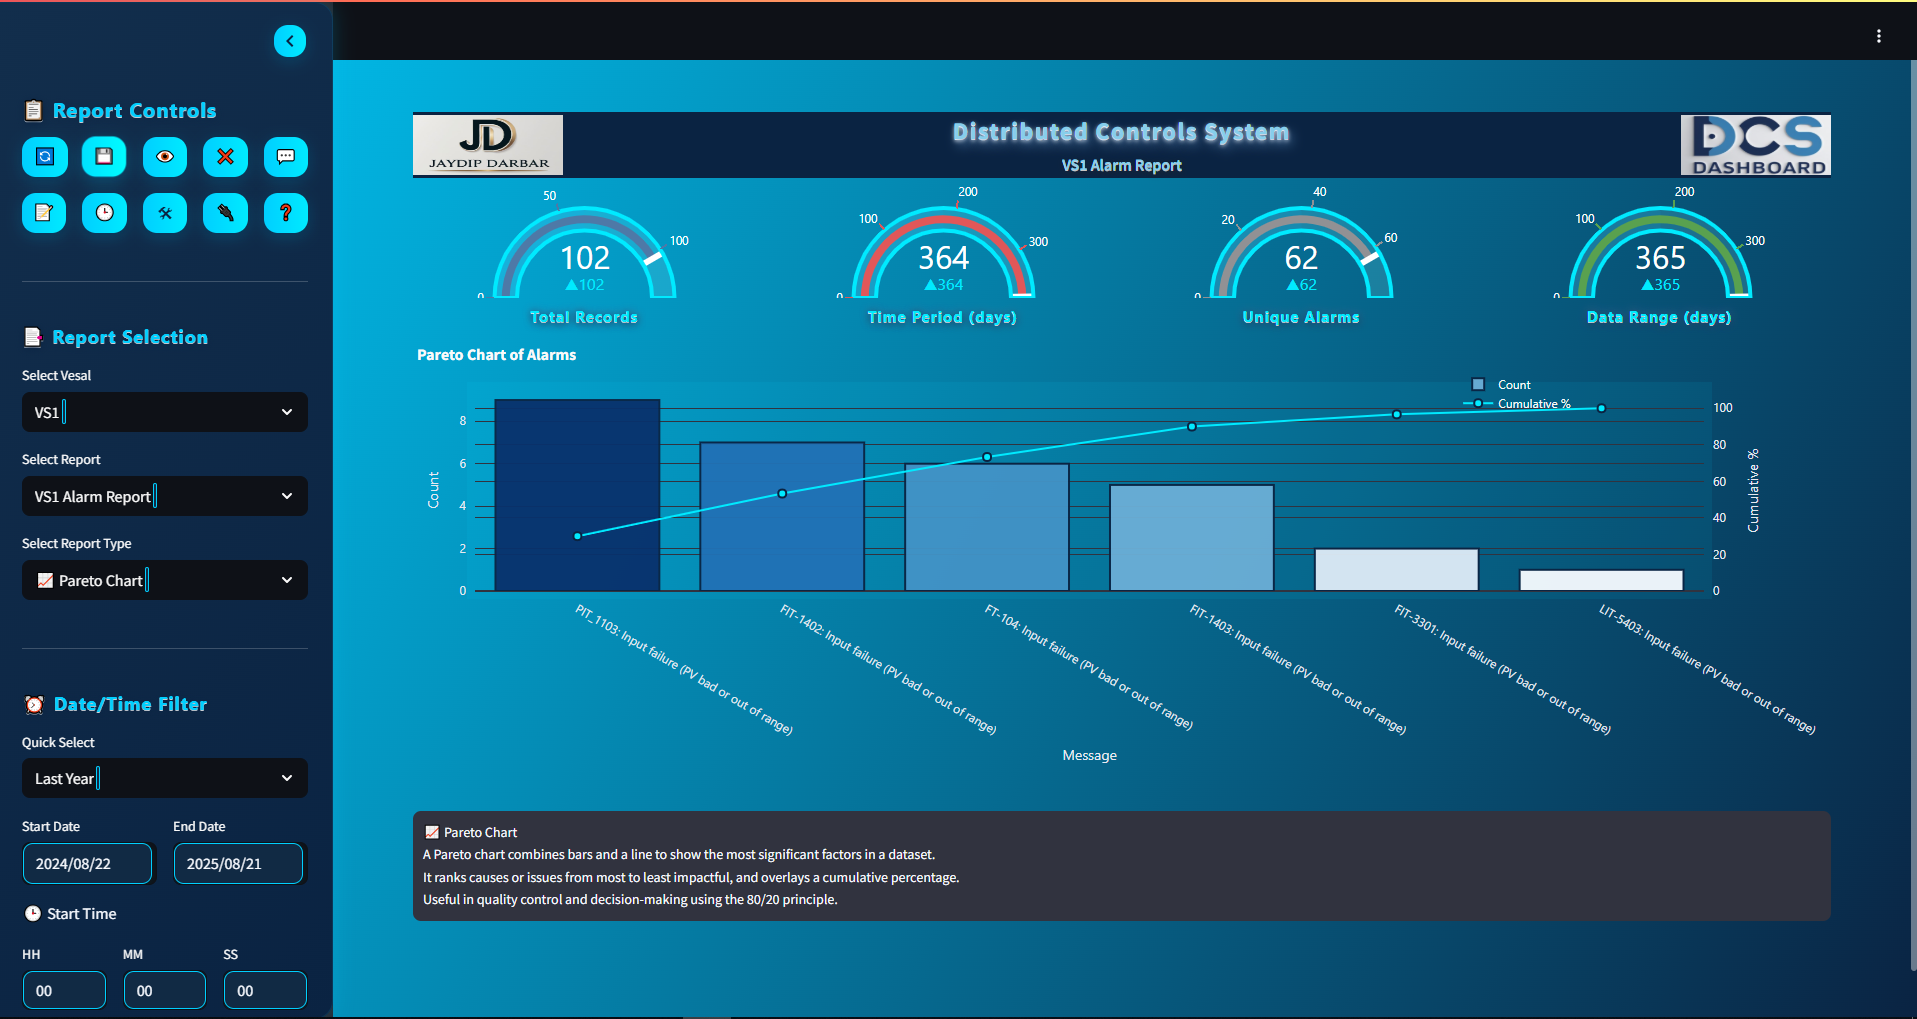
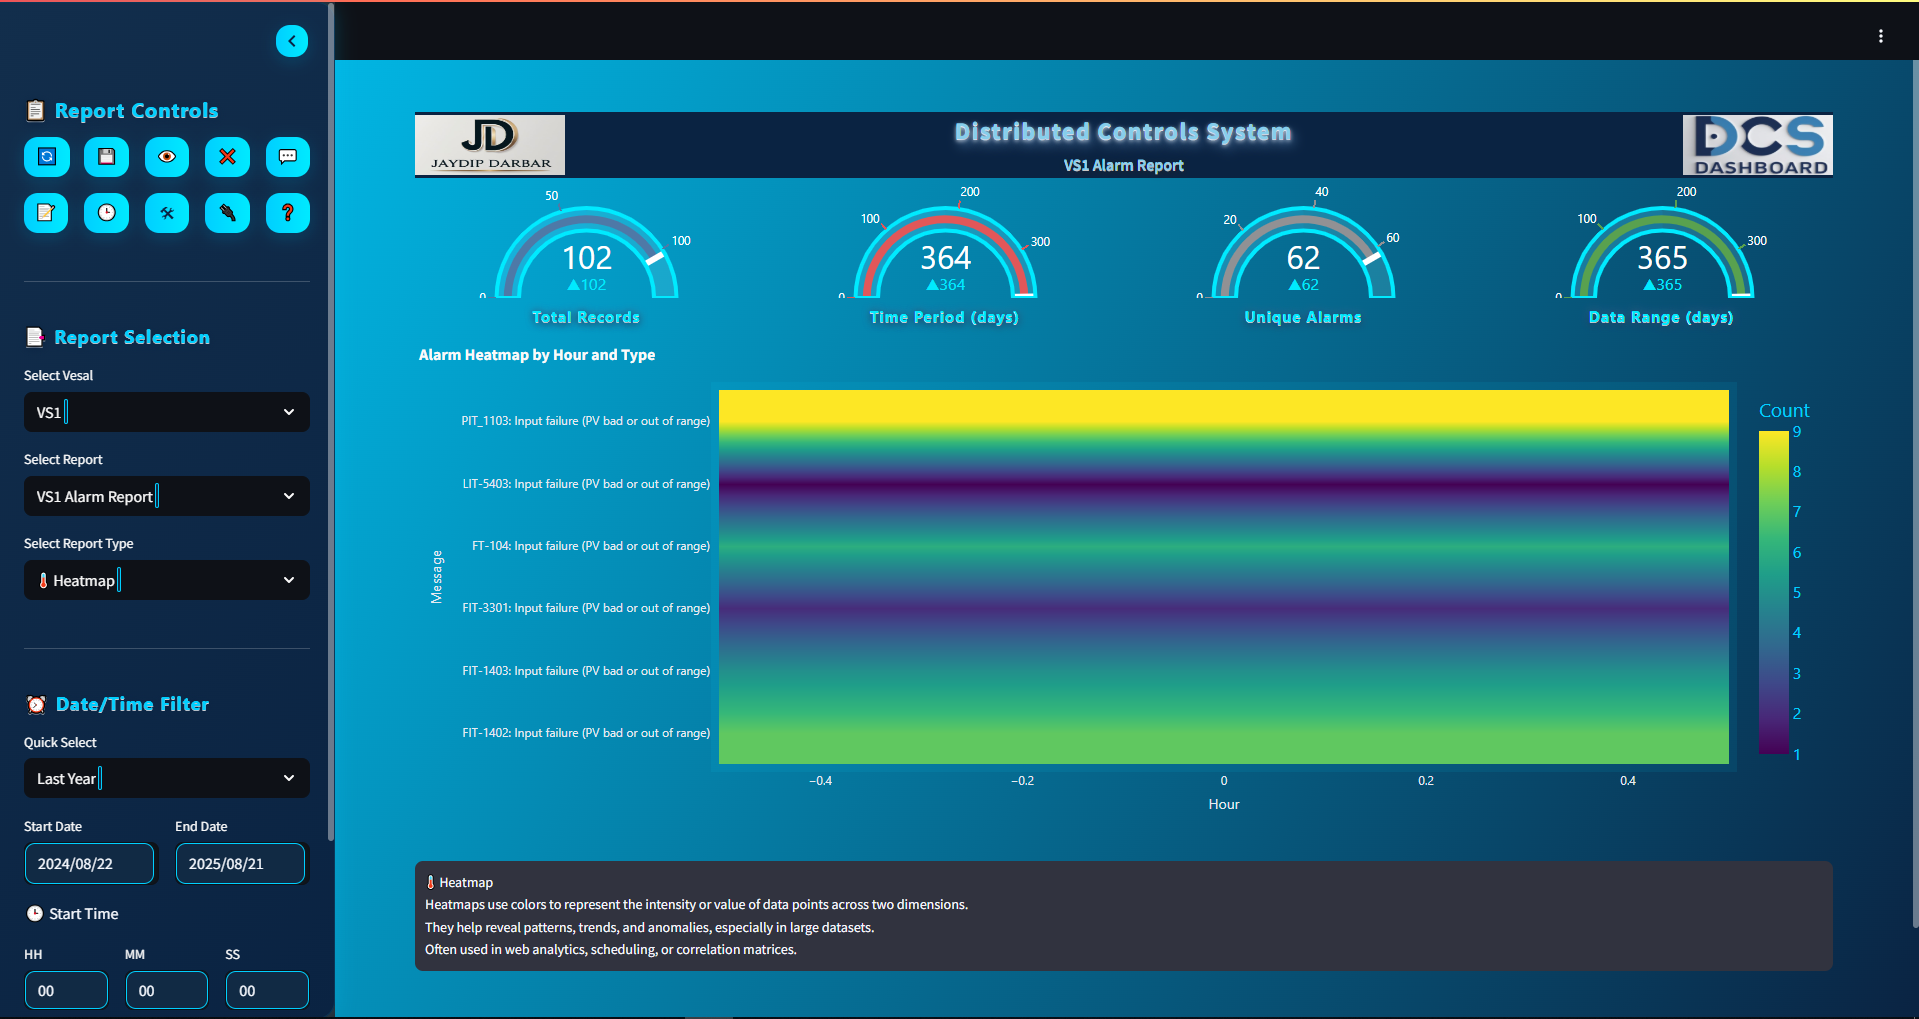
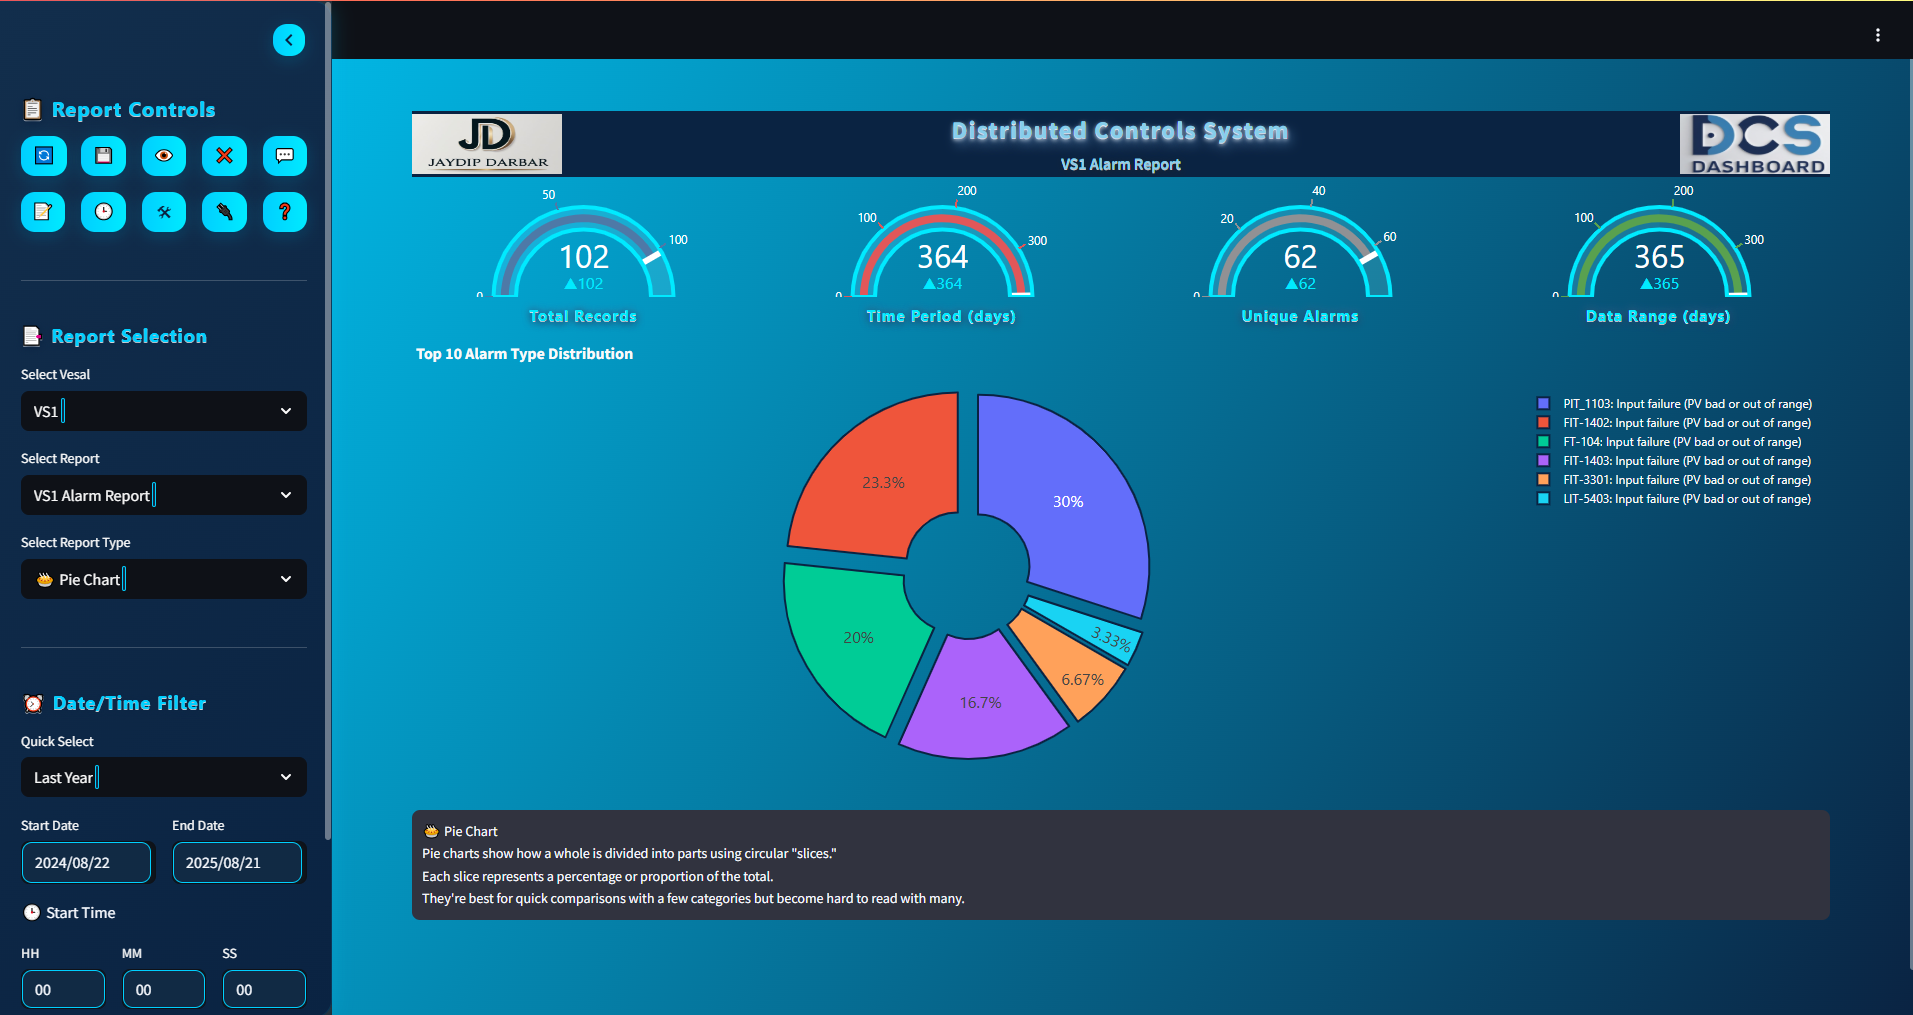
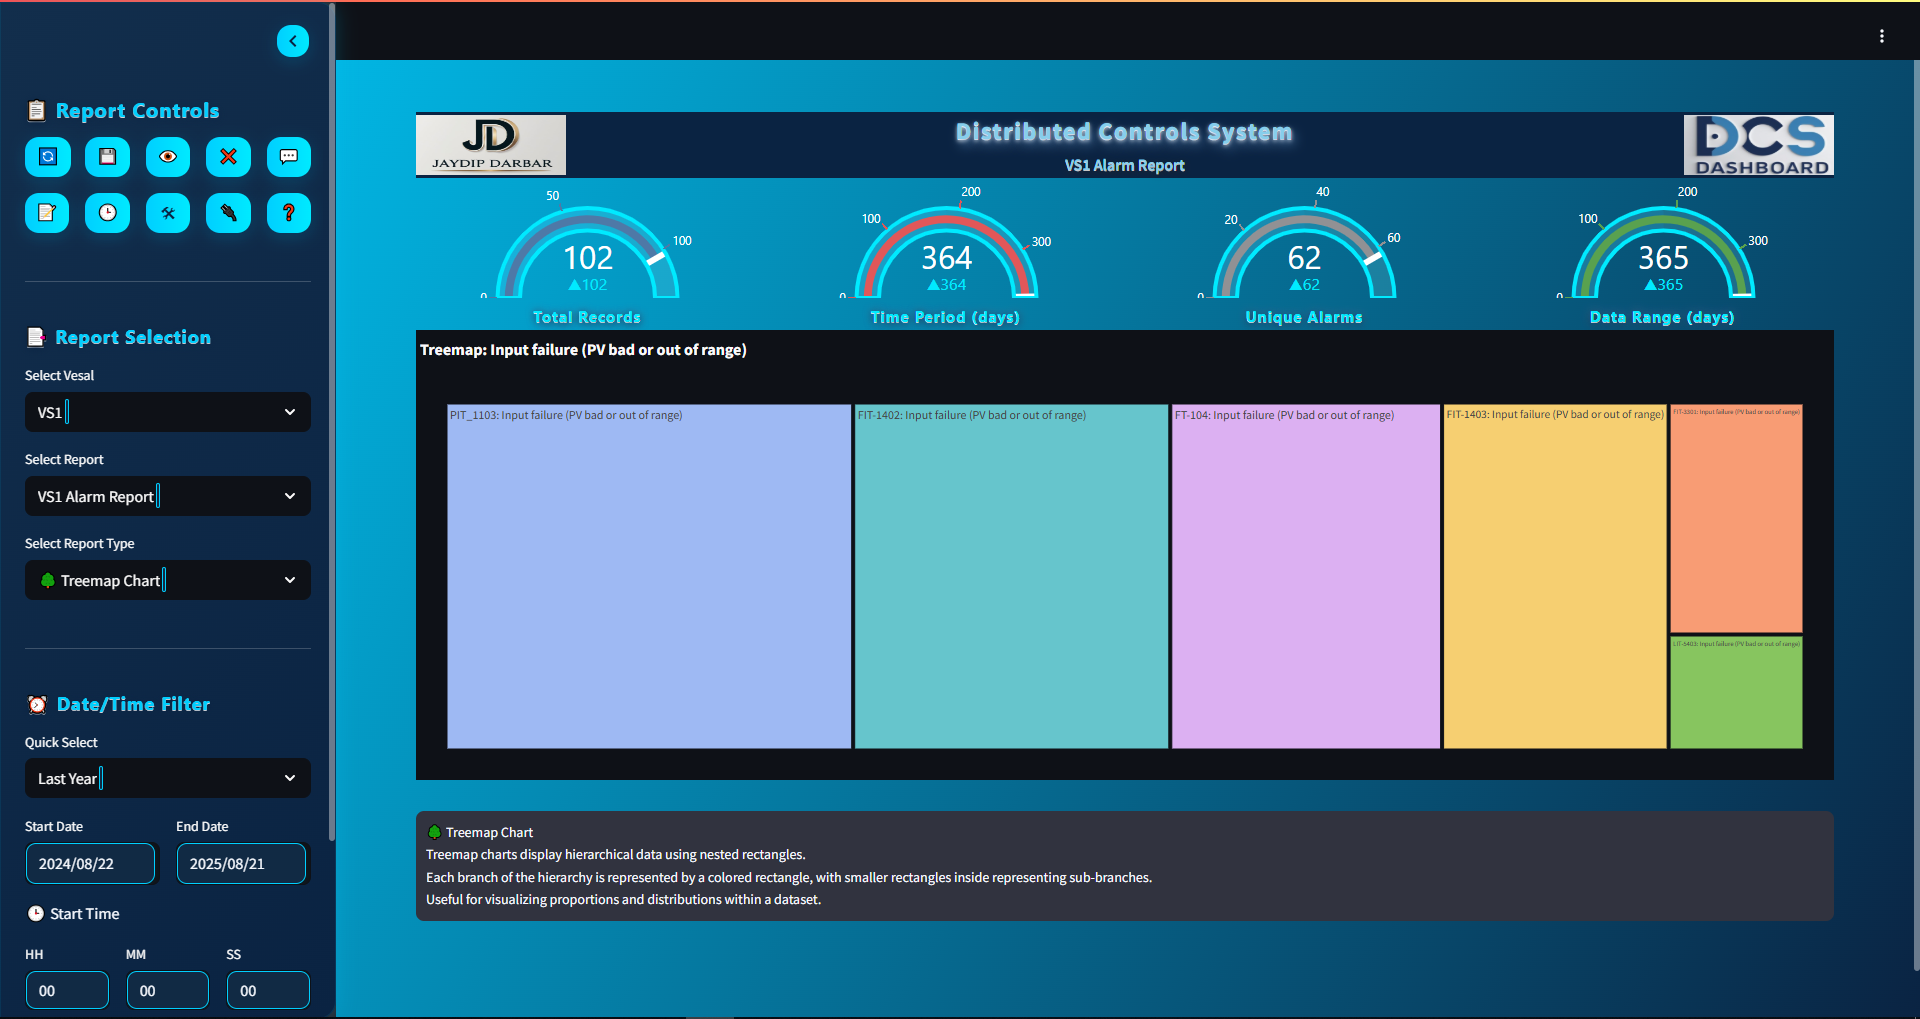
Advanced analytics and reporting using Grafana, Power BI, and Visual Studio
Automated dashboards for OEE (Overall Equipment Effectiveness), downtime analysis, and performance monitoring
🌐IIoT & Digital Transformation
Specialize in architecting IIoT-driven frameworks that connect shop-floor devices to enterprise systems and cloud environments.
Edge-to-Cloud Data Integration:
Hands-on expertise with Kepware, MQTT, Node-RED for secure real-time connectivity
Designing HiveMQ & Kafka-based data streaming pipelines for high-volume industrial data
Edge analytics for near real-time decision-making
Smart Dashboards & Analytics:
Customized Grafana dashboards for OEE, energy monitoring, predictive maintenance, and downtime analysis
Role-based dashboards tailored for operators, managers, and executives
Intelligent Notifications & Alarms:
Designed automated Email (SMTP) and SMS-based notifications for production issues, downtime alerts, and safety conditions
Integration of alerts with mobile and enterprise platforms
Legacy Modernization:
Migrated older PLC/DCS systems into IIoT-ready infrastructures using OPC UA and KepServerEX
Improved system visibility and lifecycle management without costly hardware replacement
Cybersecurity & Networking:
Implemented VLAN segmentation, OT firewalls, NAT routing, and secure remote access systems
Adhered to ISA/IEC 62443 security frameworks to protect industrial assets from cyber threats
🌟Key Project Highlights & Leadership Achievements
Pharmaceutical Industry:
Designed and deployed validated automation and historian solutions that complied with GxP and FDA 21 CFR Part 11 requirements
Enabled complete process traceability, audit trails, and batch reporting for compliance
Glass Manufacturing:
Implemented high-availability SCADA with redundant servers and historian integration
Delivered advanced production insights, energy monitoring, and downtime tracking
Dairy and Food Processing:
Designed IIoT dashboards for OEE improvements and predictive maintenance
Reduced downtime through real-time SMS/email alerts and proactive maintenance planning
Commissioning & Execution:
Led Factory Acceptance Tests (FAT), Site Acceptance Tests (SAT), and commissioning projects in India and Sri Lanka
Managed cross-disciplinary teams to ensure on-time, within-budget project delivery
Network Architecture:
Designed Layer 2/3 OT networks, integrated VLANs, and configured secure NAT and VPN access for remote troubleshooting
Created resilient and cyber-secure industrial networks that supported both legacy and modern devices
Training & Documentation:
Conducted knowledge transfer workshops, developed Standard Operating Procedures (SOPs), and trained IT/OT teams for post-project sustainability
📈Looking Ahead
Designing scalable IIoT frameworks for enterprises of all sizes
Building cloud-ready data pipelines that support AI/ML-driven analytics
Enhancing predictive maintenance and operational intelligence through real-time data insights
Enabling secure IT-OT convergence with robust cybersecurity and compliance frameworks
Supporting industries in their journey toward digital twins and smart factories
📬Let’s Connect
I work on Industrial Automation, IIoT, Smart Manufacturing, and OT-IT integration projects — from control system design and commissioning to data pipelines, dashboards, and secure network architectures.
If you are working on automation, IIoT, or digital transformation projects and would like to connect, feel free to reach me at:
For more details, source code, documentation, or project understanding,
please contact me at jrdarbar1996@gmail.com.
Cloud-Connected PLC Data Pipeline
Purpose: Enable real-time plant-to-cloud data transfer for smart manufacturing monitoring — low-latency visibility across the shop floor and remote locations.
Detailed Architecture:
PLC → Node-RED (on-premise gateway)
Industrial drivers: node-red-contrib-opcua for OPC UA, or node-red-contrib-ethernet-ip for Allen-Bradley.
Tag scan rates tuned to avoid network congestion (e.g., 1 sec for fast process variables, 10 sec for slow).
Node-RED → MQTT (HiveMQ Cloud)
Payload format: JSON (flattened keys for easy parsing).
Topic structure: plant/<line>/<machine>/<tagName> for logical grouping.
QoS: Usually 1 (at least once), but QoS 2 for critical values.
Node-RED → Microsoft SQL Server (via node-red-contrib-mssql-plus or REST API)
Table design: timestamped rows, indexed by tag name + time.
Why this matters: MQTT makes the architecture event-driven and scalable, while SQL provides a time-series history for BI tools. This hybrid ensures both speed and traceability.
Challenges & Mitigations:
MQTT message bursts → Implement payload batching in Node-RED.
PLC comm load → Use OPC UA subscriptions instead of polling.
Cloud connectivity loss → Use MQTT persistent sessions or offline queue in Node-RED.
Kafka-Based IIoT Streaming with Secure Access
Purpose: Handle high-volume, high-frequency industrial data with built-in replay/buffering, enabling global secure access.
Detailed Architecture:
Node-RED → Kafka Producer (converts PLC/sensor data into Kafka messages)
Topic design: plant.line1.temp or hierarchical: plant/line1/temp
Keyed messages for partition ordering (e.g., device ID as key)
Kafka Broker Cluster (replication factor ≥ 2 for high availability)
Retention policy set to weeks/months for replay capability
Kafka Consumer → SQL Server (batch insert, downsampling)
Remote Access via ZeroTier (virtual static IP, no VPN appliances)
Dashboards stream live from Kafka or read historical from SQL
Why this matters: Kafka supports backfill and replay, essential in intermittent network environments.
Challenges & Mitigations:
Kafka learning curve → Pre-built connectors in Node-RED help.
Large DB growth → Use tiered storage (Kafka to S3, SQL for latest only).
Remote data security → ZeroTier with ACL rules for access control.
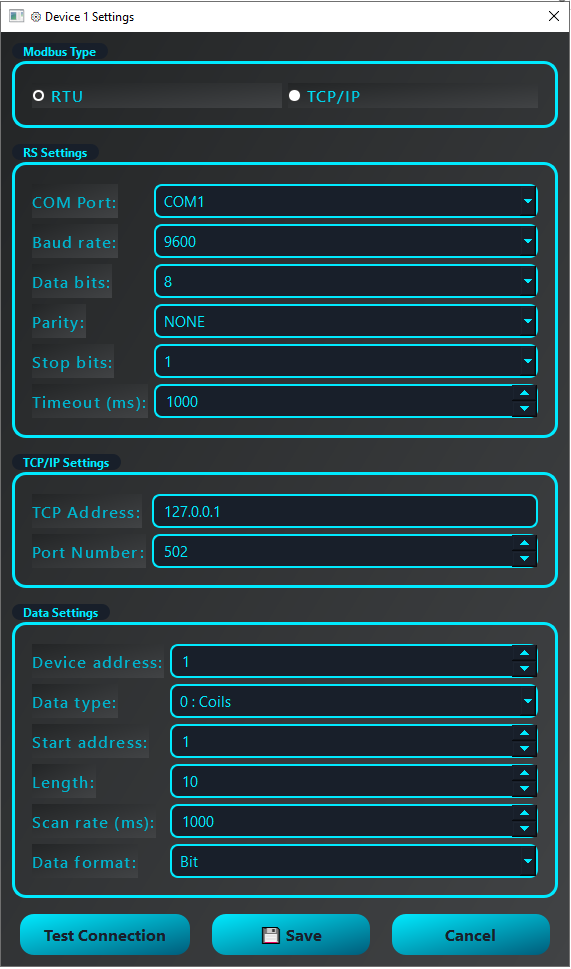
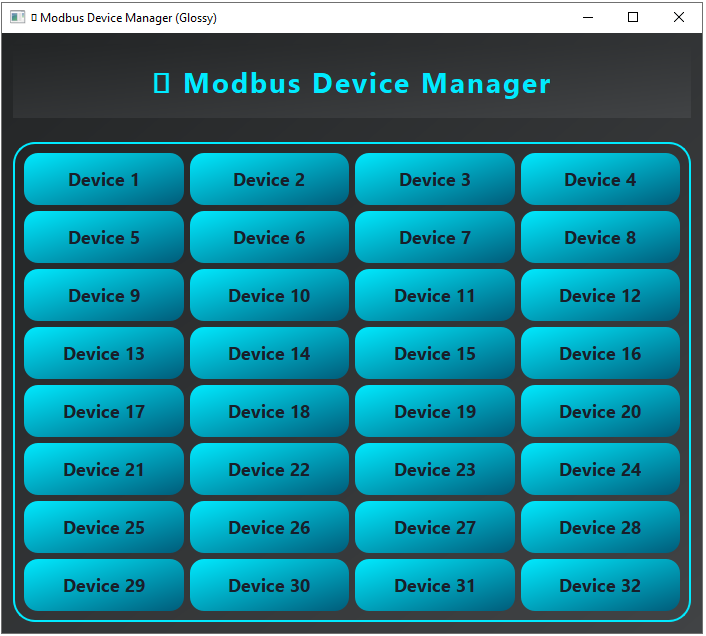
Modbus RTU/TCP Data Collection Without PLC
Purpose: Directly read field sensors/meters to cut PLC costs in small systems.
Detailed Architecture:
Field Device → RS485 (Modbus RTU)
Baud rate, parity, stop bits set according to manufacturer specs
Modbus polling interval optimized for sensor update rate
pymodbus (Python) runs as a polling loop
Exception handling for timeouts and CRC errors
Dashboard: Flask/Dash for web-based monitoring
Real-time updates using Flask-SocketIO or Dash callbacks
Optional Logging: SQLite or CSV append
Why this matters: Removes PLC for simple measurement tasks, ideal for utilities, energy meters, and water plants.
Challenges & Mitigations:
RS485 noise → Use shielded twisted pair and termination resistors.
Multiple devices → Correct addressing and master/slave handling.
Python crashes → Use watchdog scripts or systemd services to auto-restart.
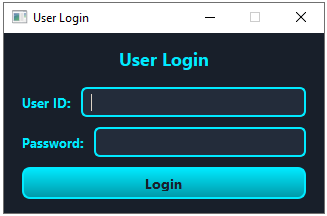
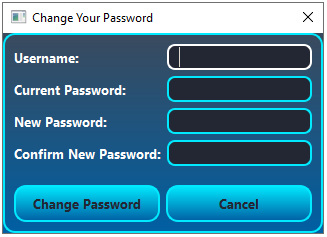
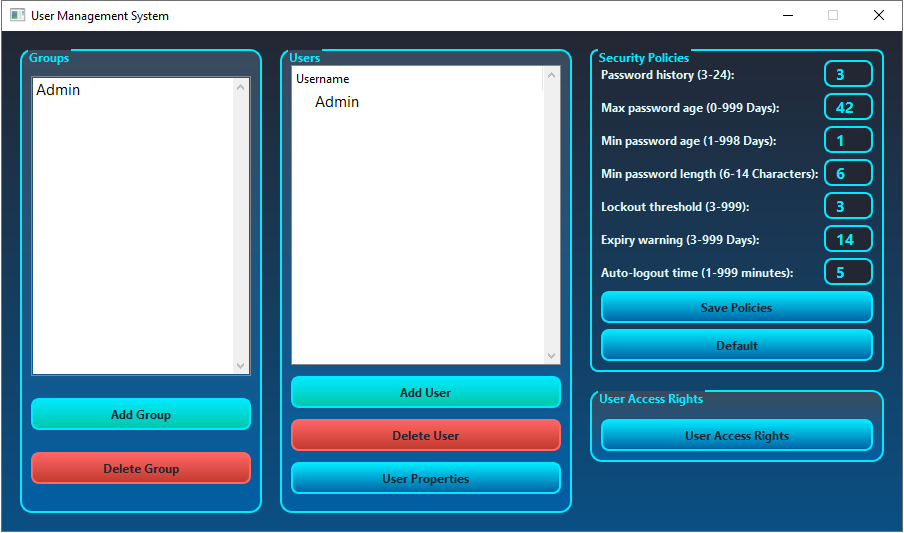
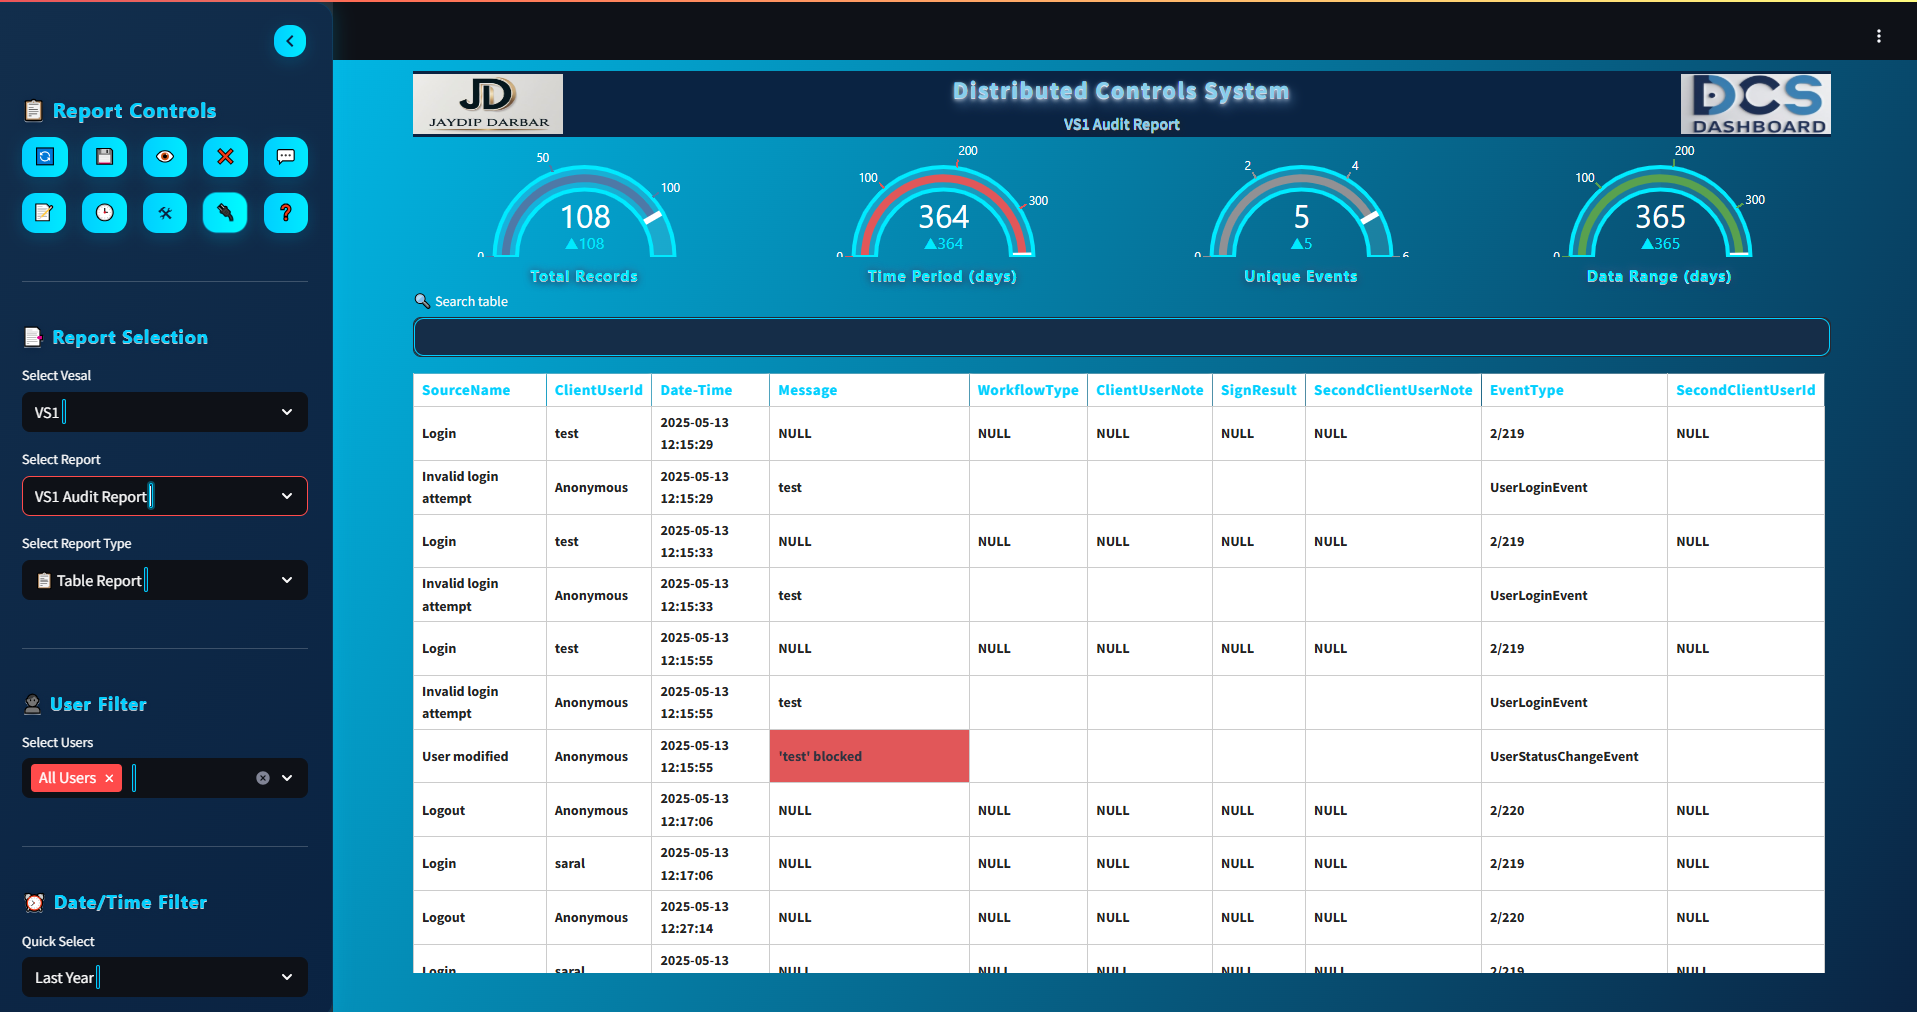
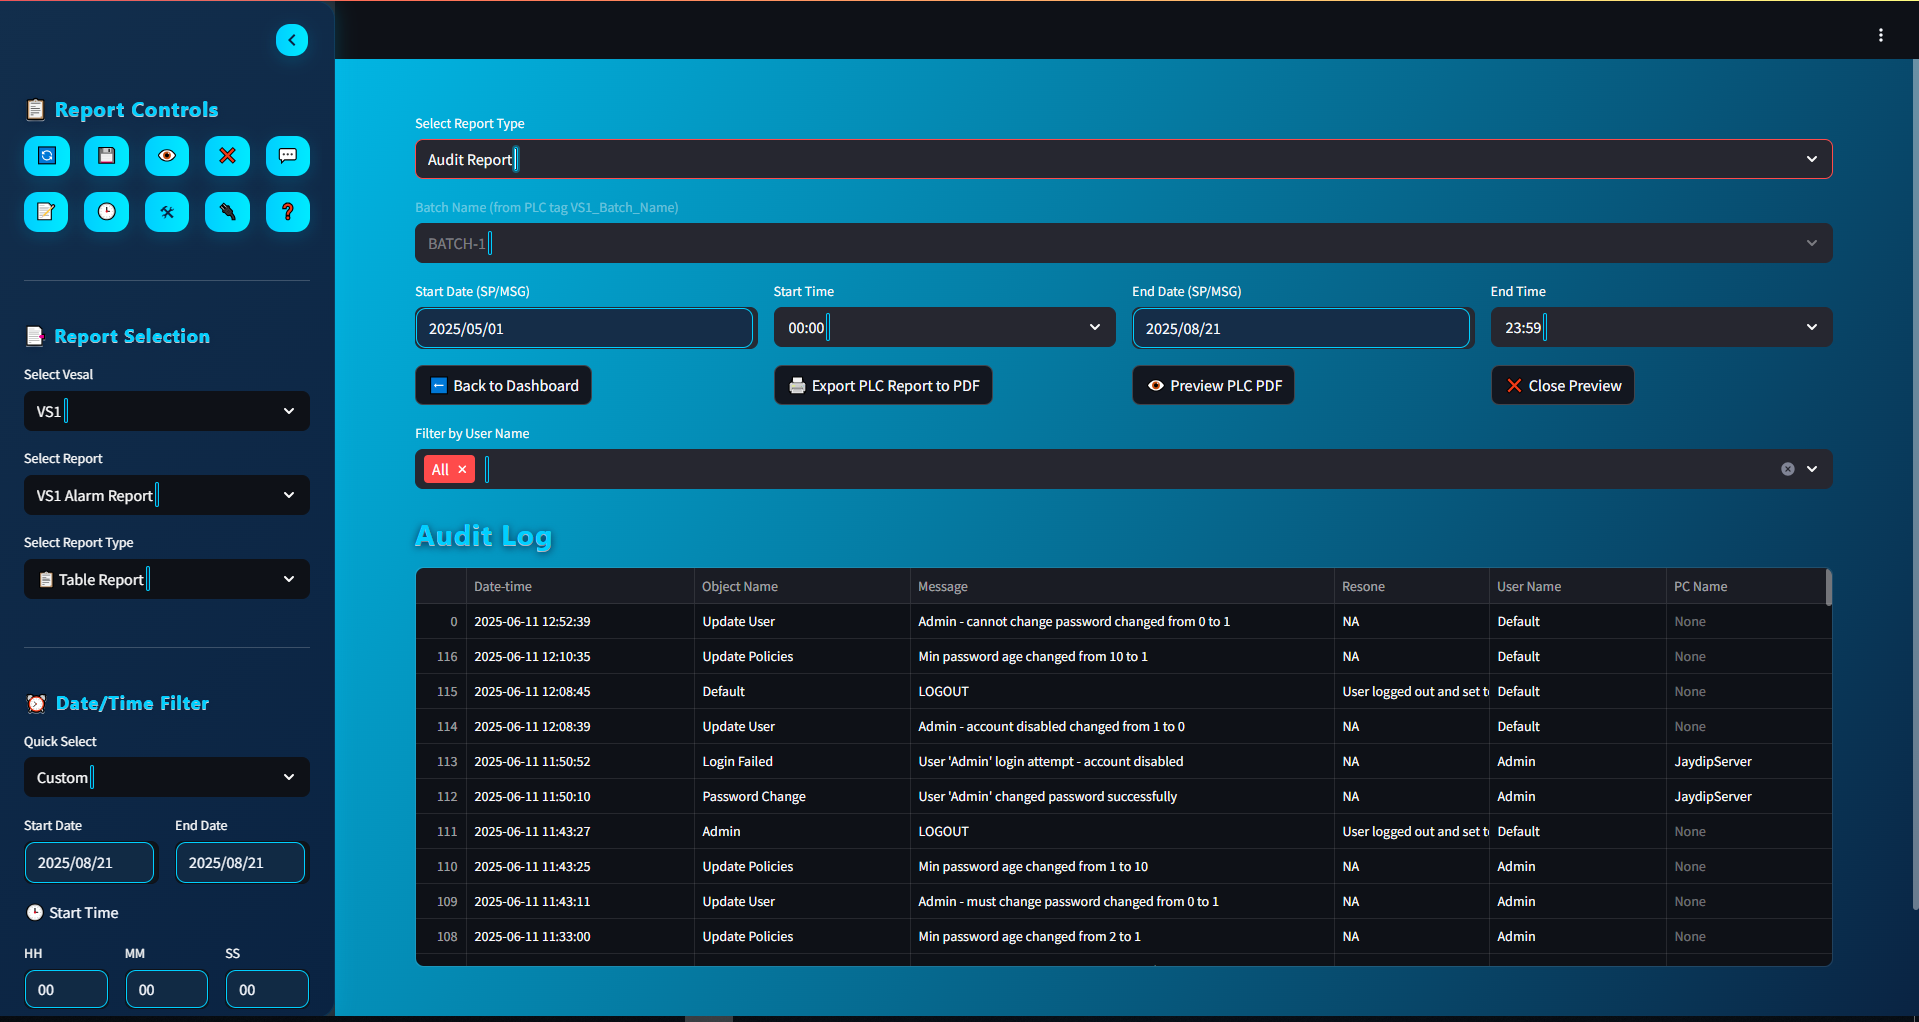
Python-Based User Management (21 CFR Part 11 Compliant)
Purpose: Replace legacy SCADA authentication with a modern, regulatory-compliant system.
Detailed Architecture:
PySide6 Frontend: Login screen, user creation, password reset dialogs
Modern styling (Qt Stylesheets) to match SCADA themes
SQLite Backend: Encrypted password storage (bcrypt or Argon2)
Audit log table with user_id, action, timestamp, signature
Role-Based Access Control (RBAC): Operator, Engineer, Admin
Fine-grained permissions mapped to screens/actions
Audit Trail: Every change digitally signed (hash + user key)
Integration: REST API or OPC UA method call to SCADA/HMI
Why this matters: 21 CFR Part 11 is mandatory for pharma, biotech, and food — this provides a paperless, fully traceable system.
Challenges & Mitigations:
User training → Simple UI, avoid over-complication.
Database security → Encrypted transport & storage.
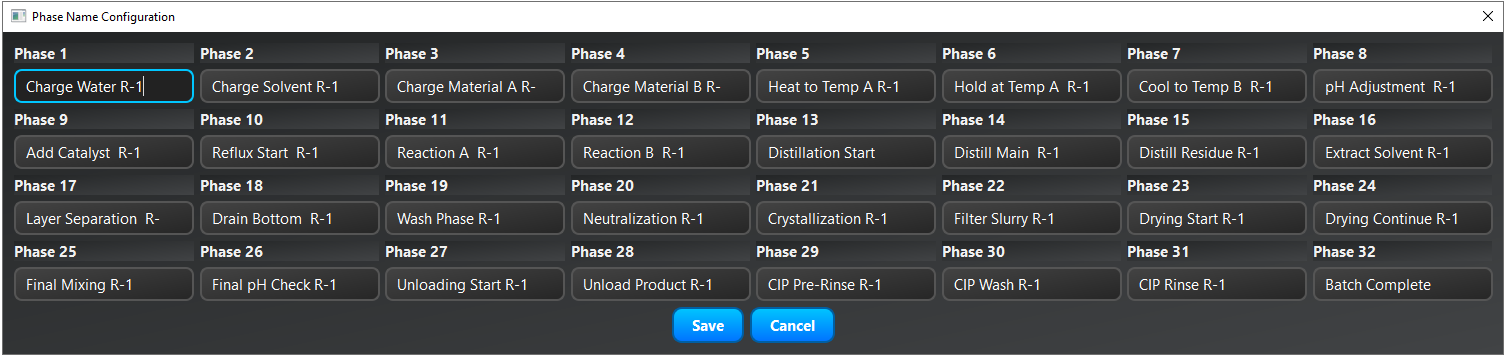
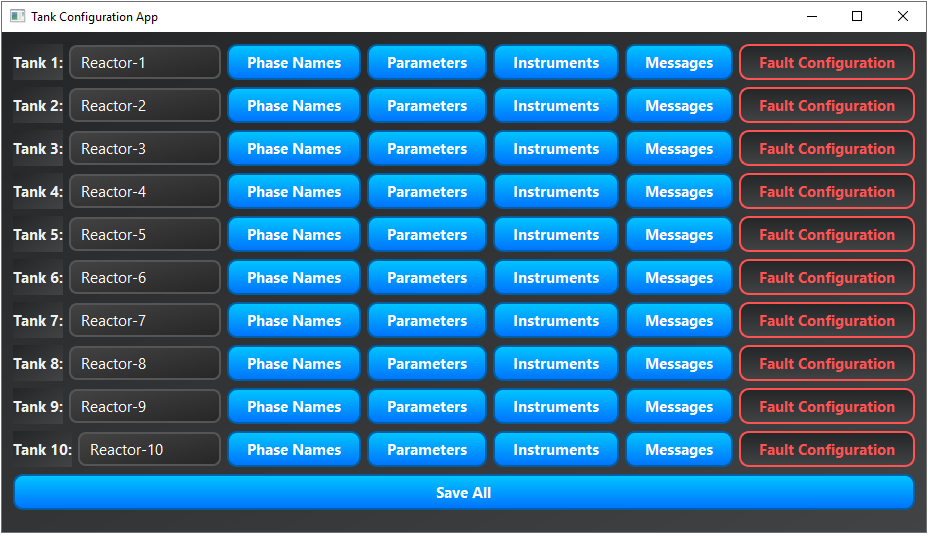
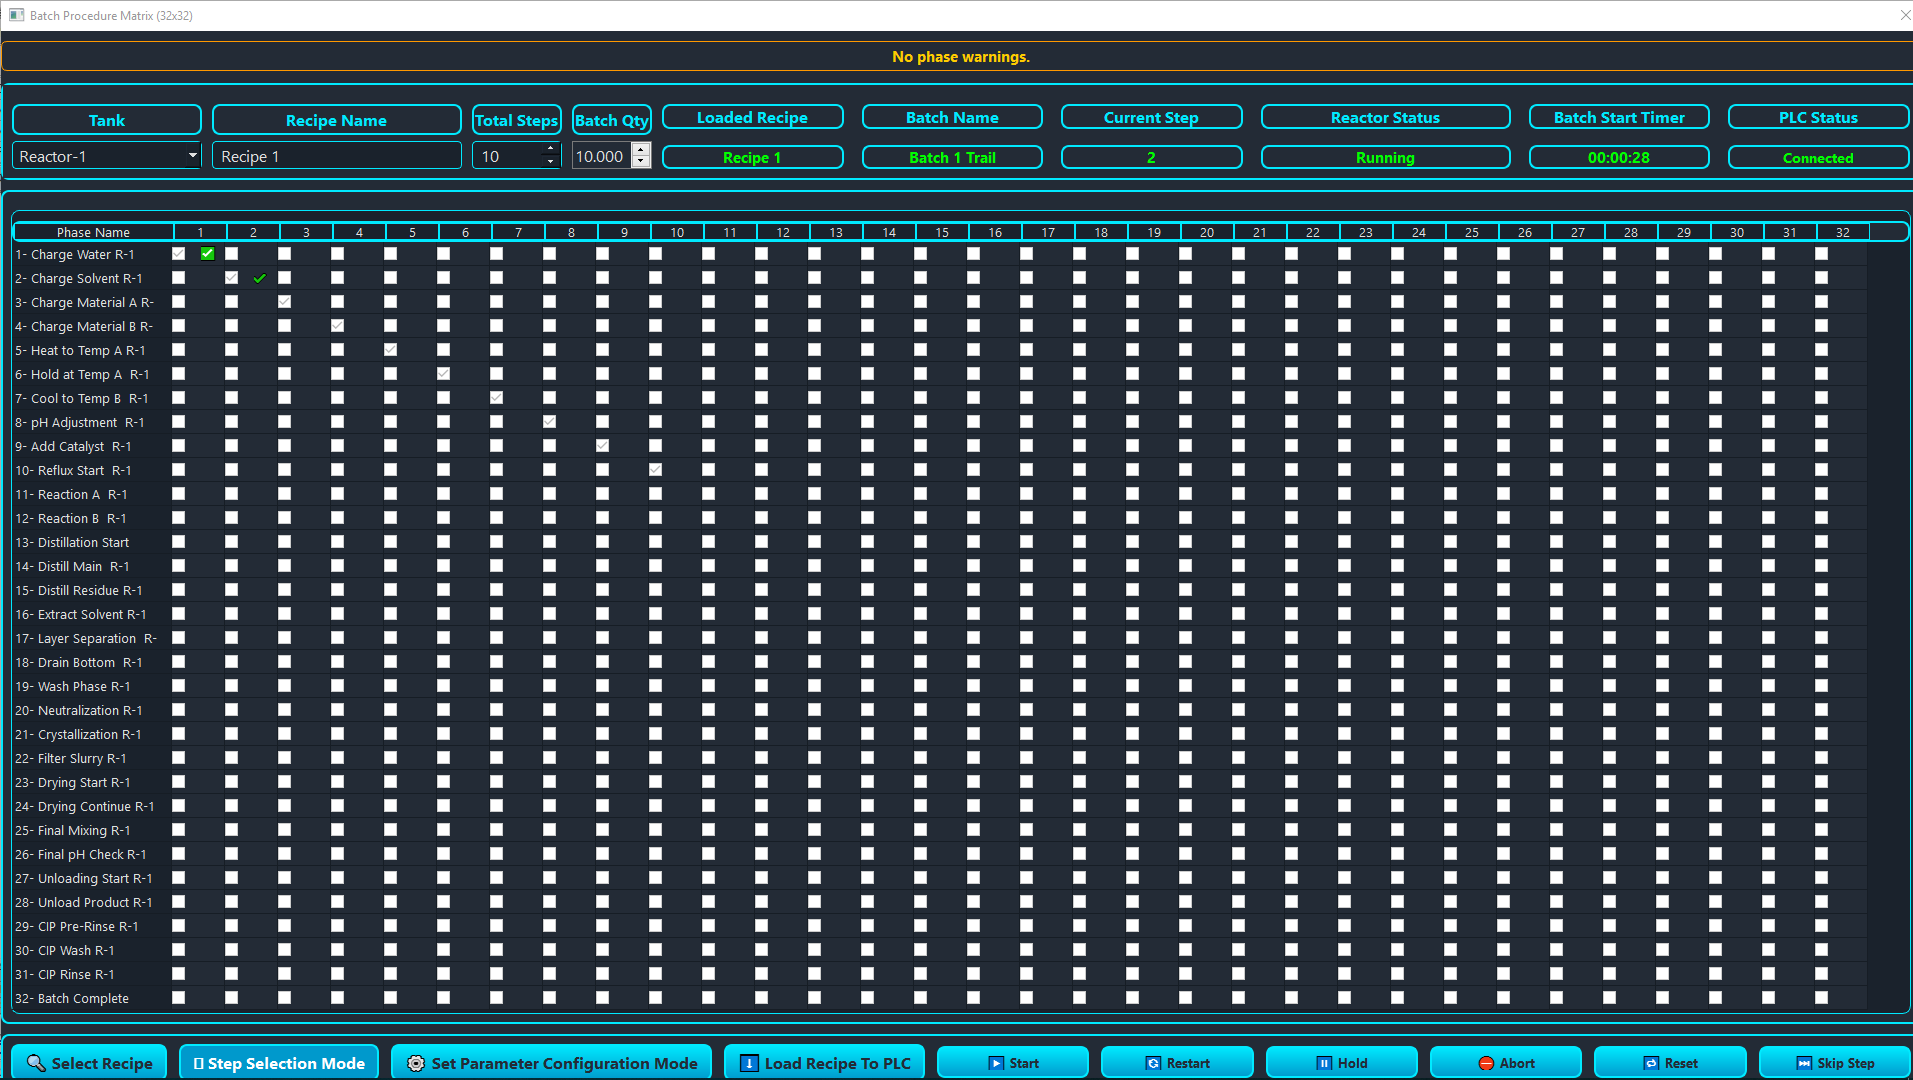
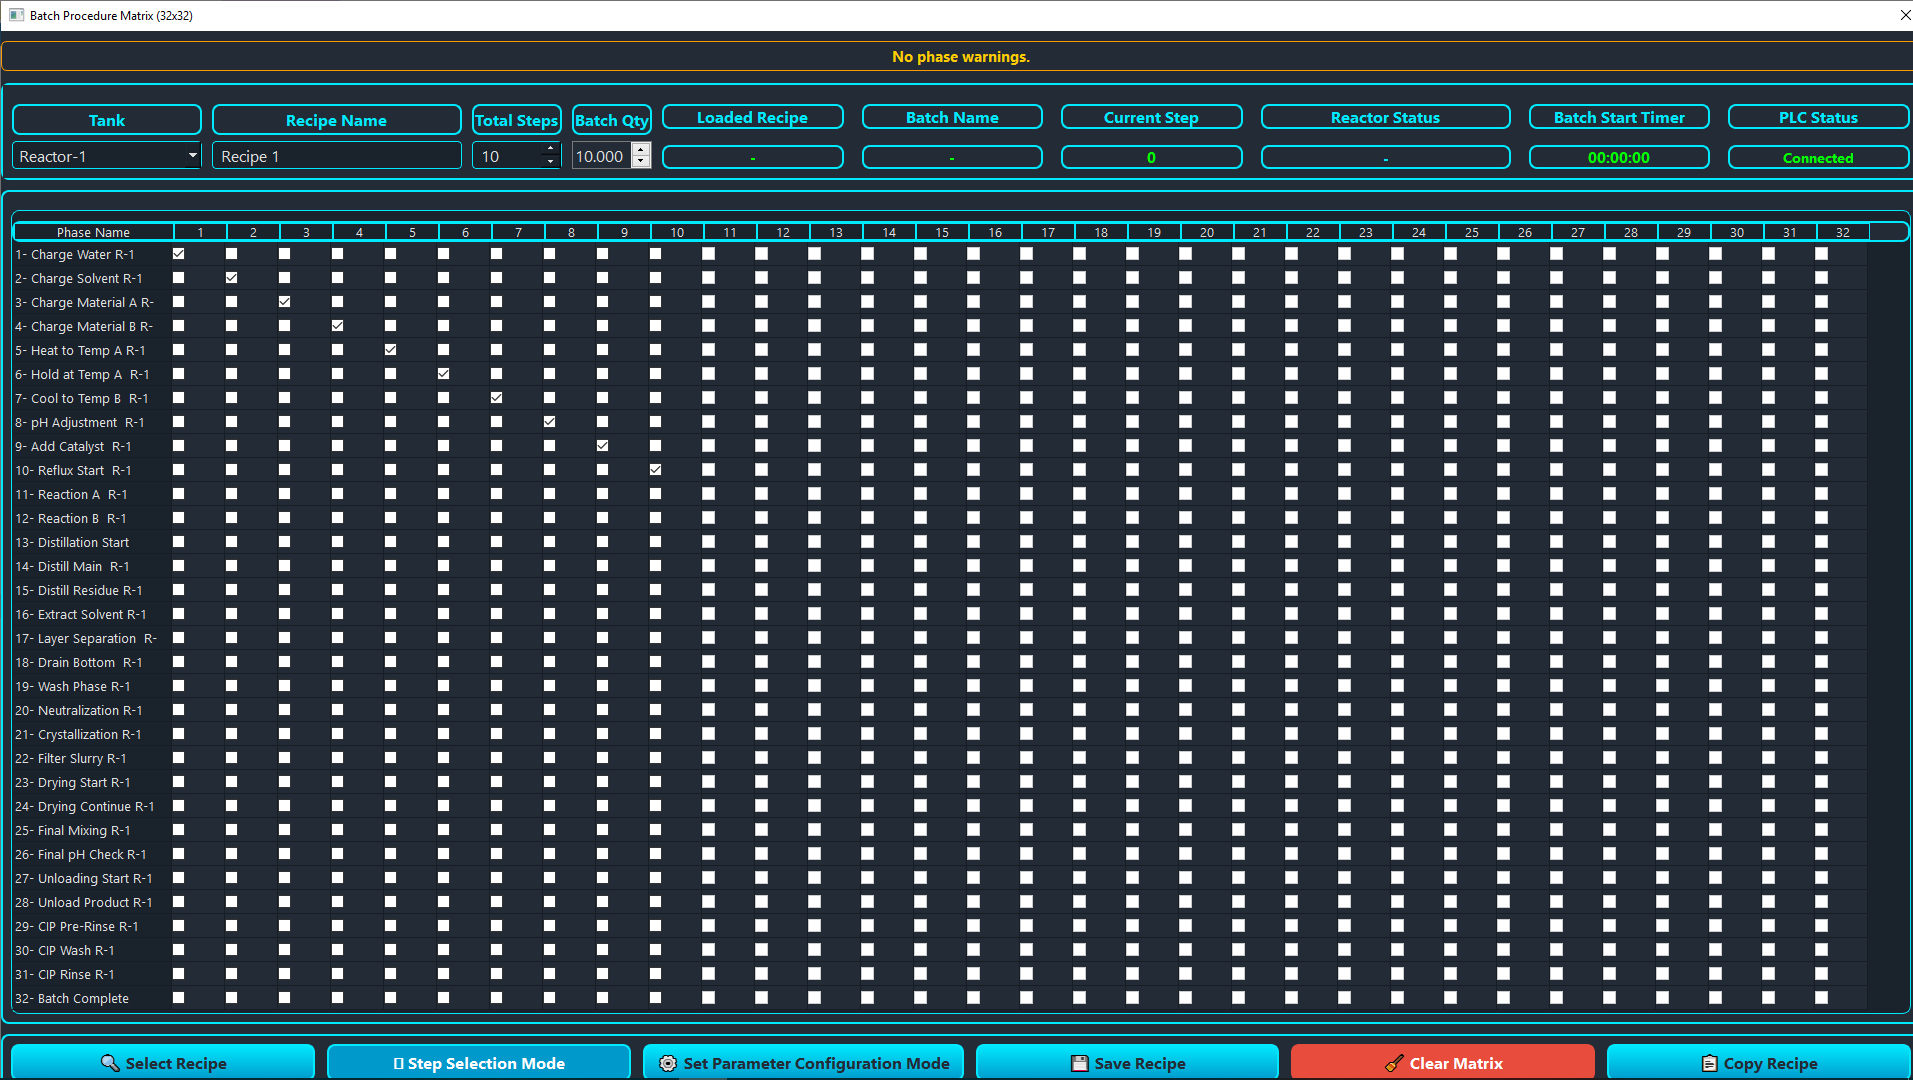
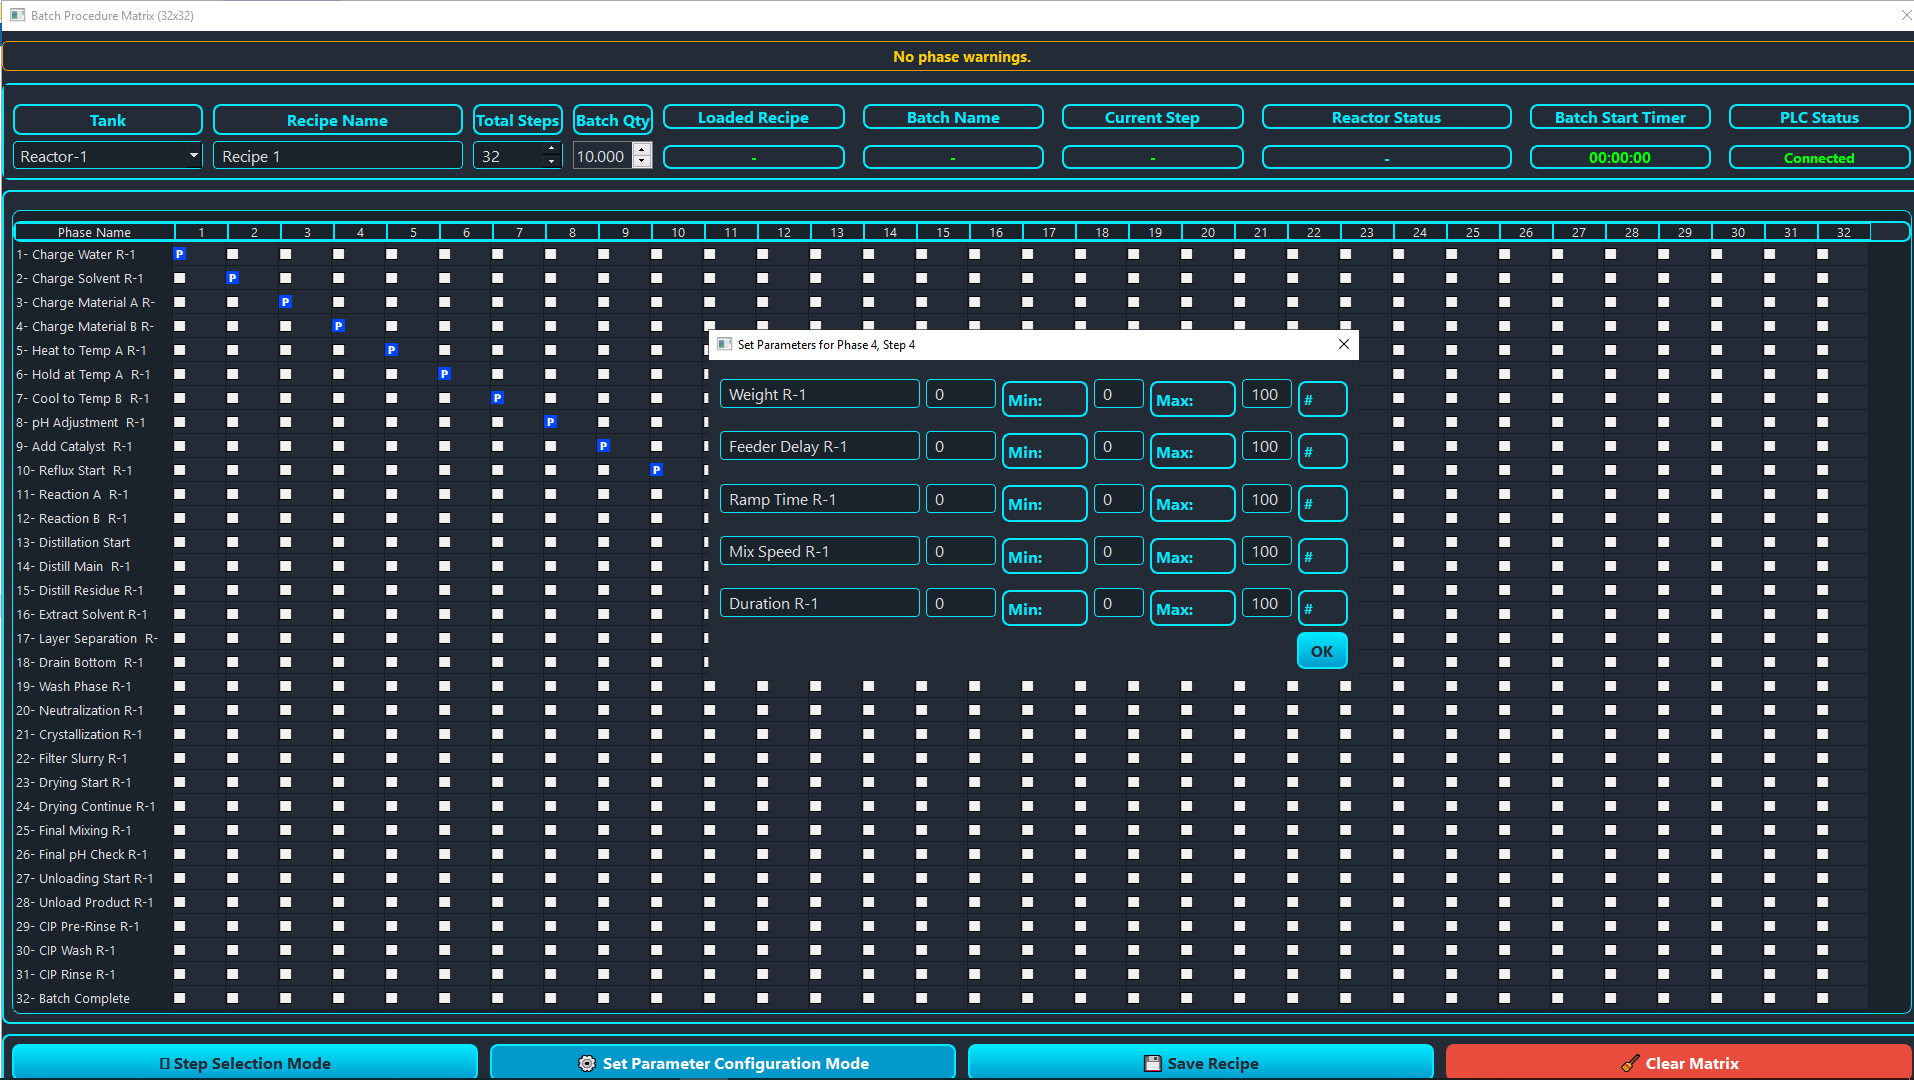
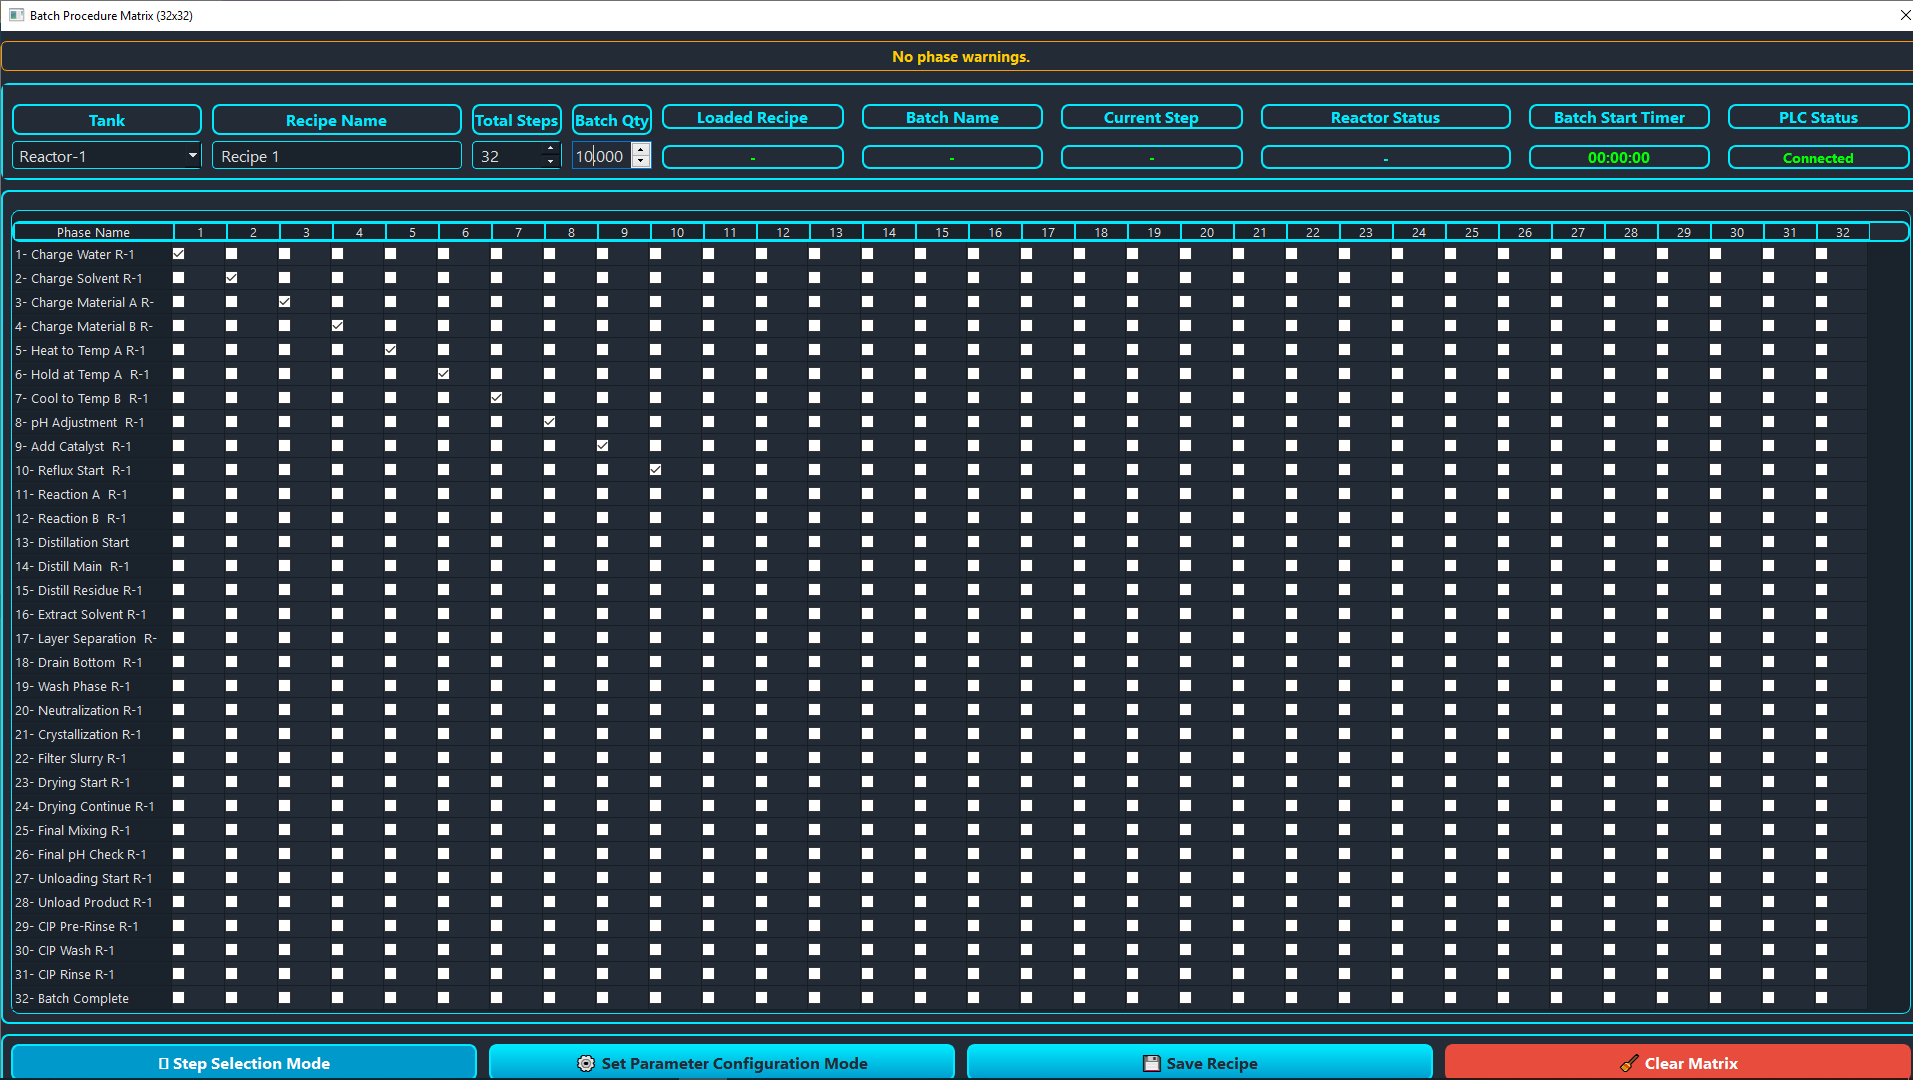
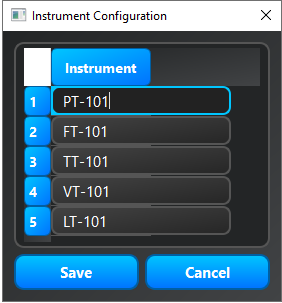
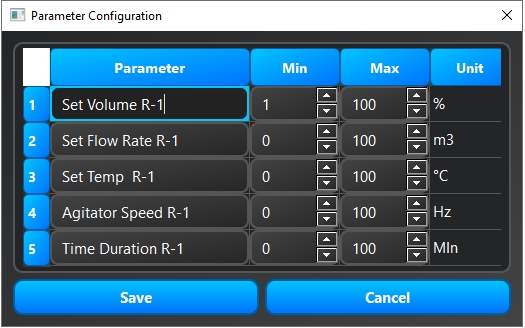
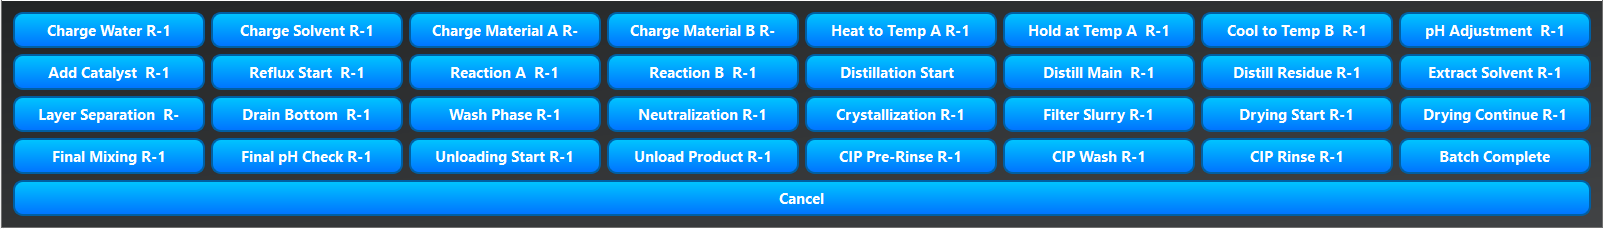
Why this matters: Removes PLC program change overhead for new recipes — faster commissioning.
Challenges & Mitigations:
PLC sync → Heartbeat tag to avoid drift.
Network latency → Preload next phase before step ends.
Fail-safes → Auto-hold batch if comm loss occurs.
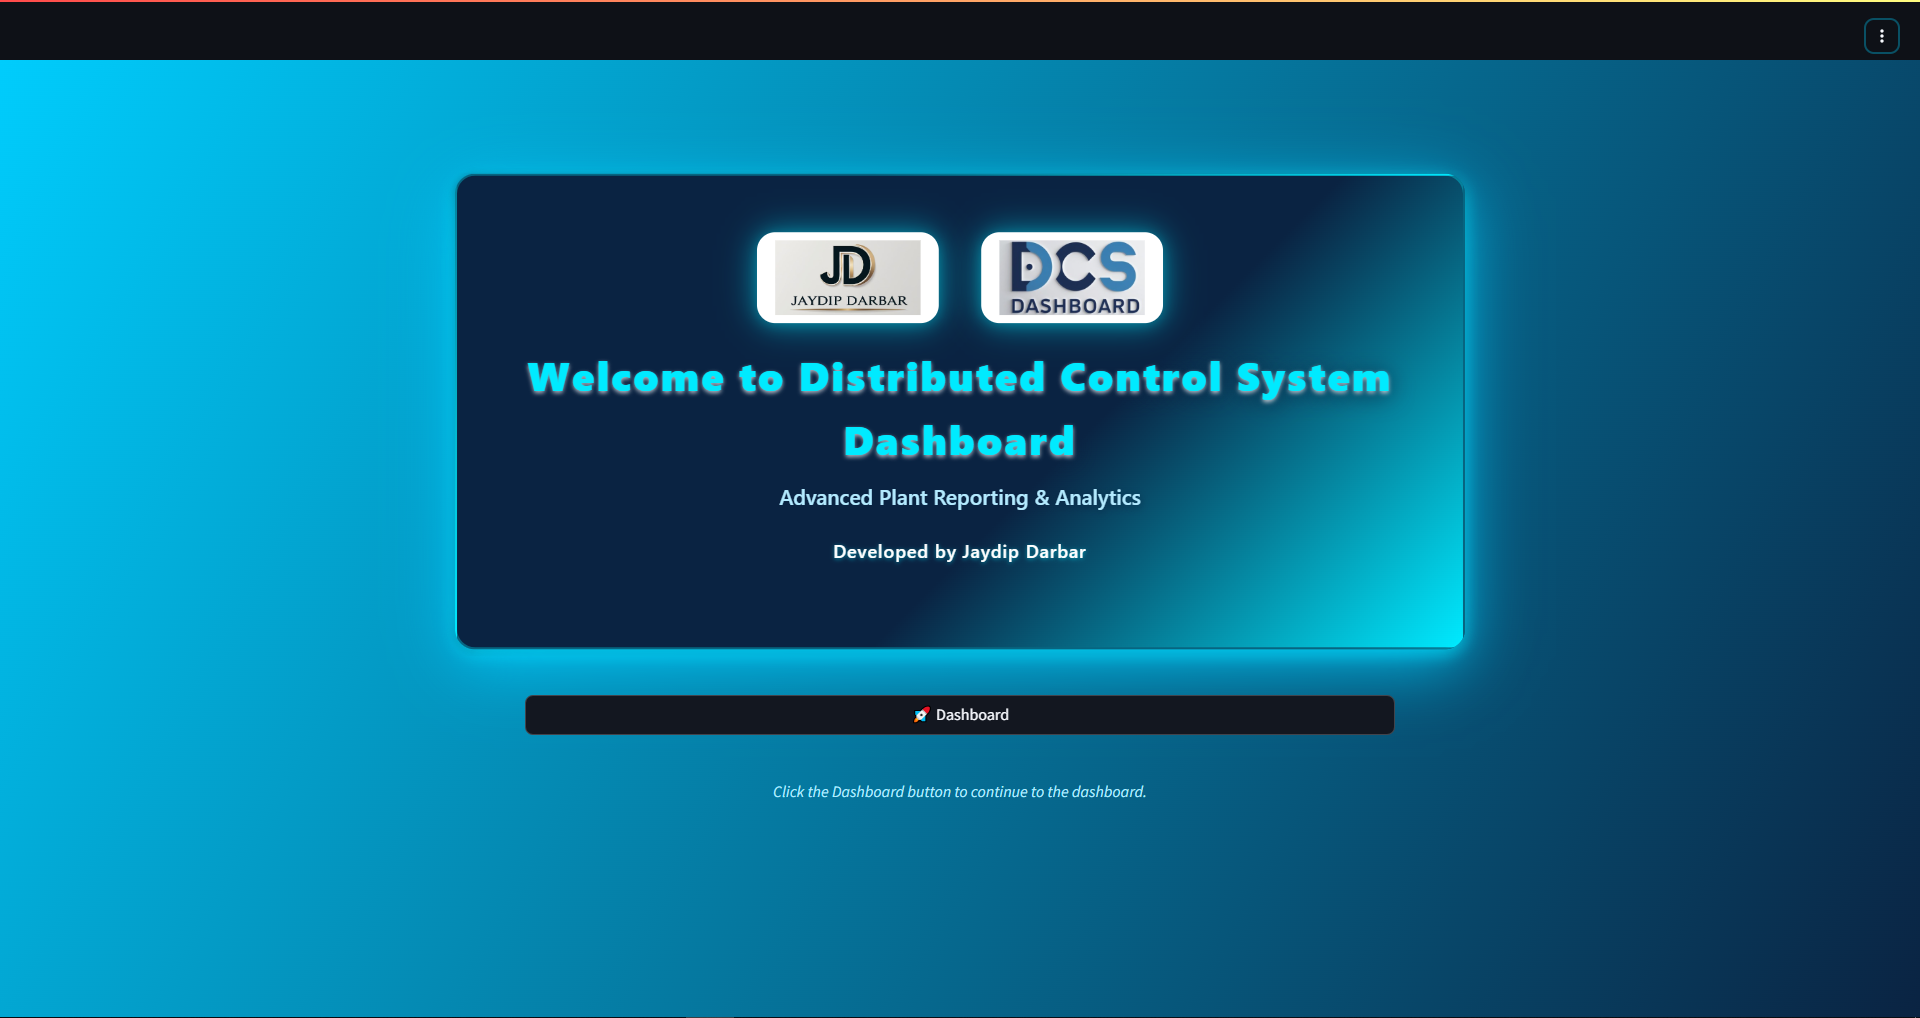
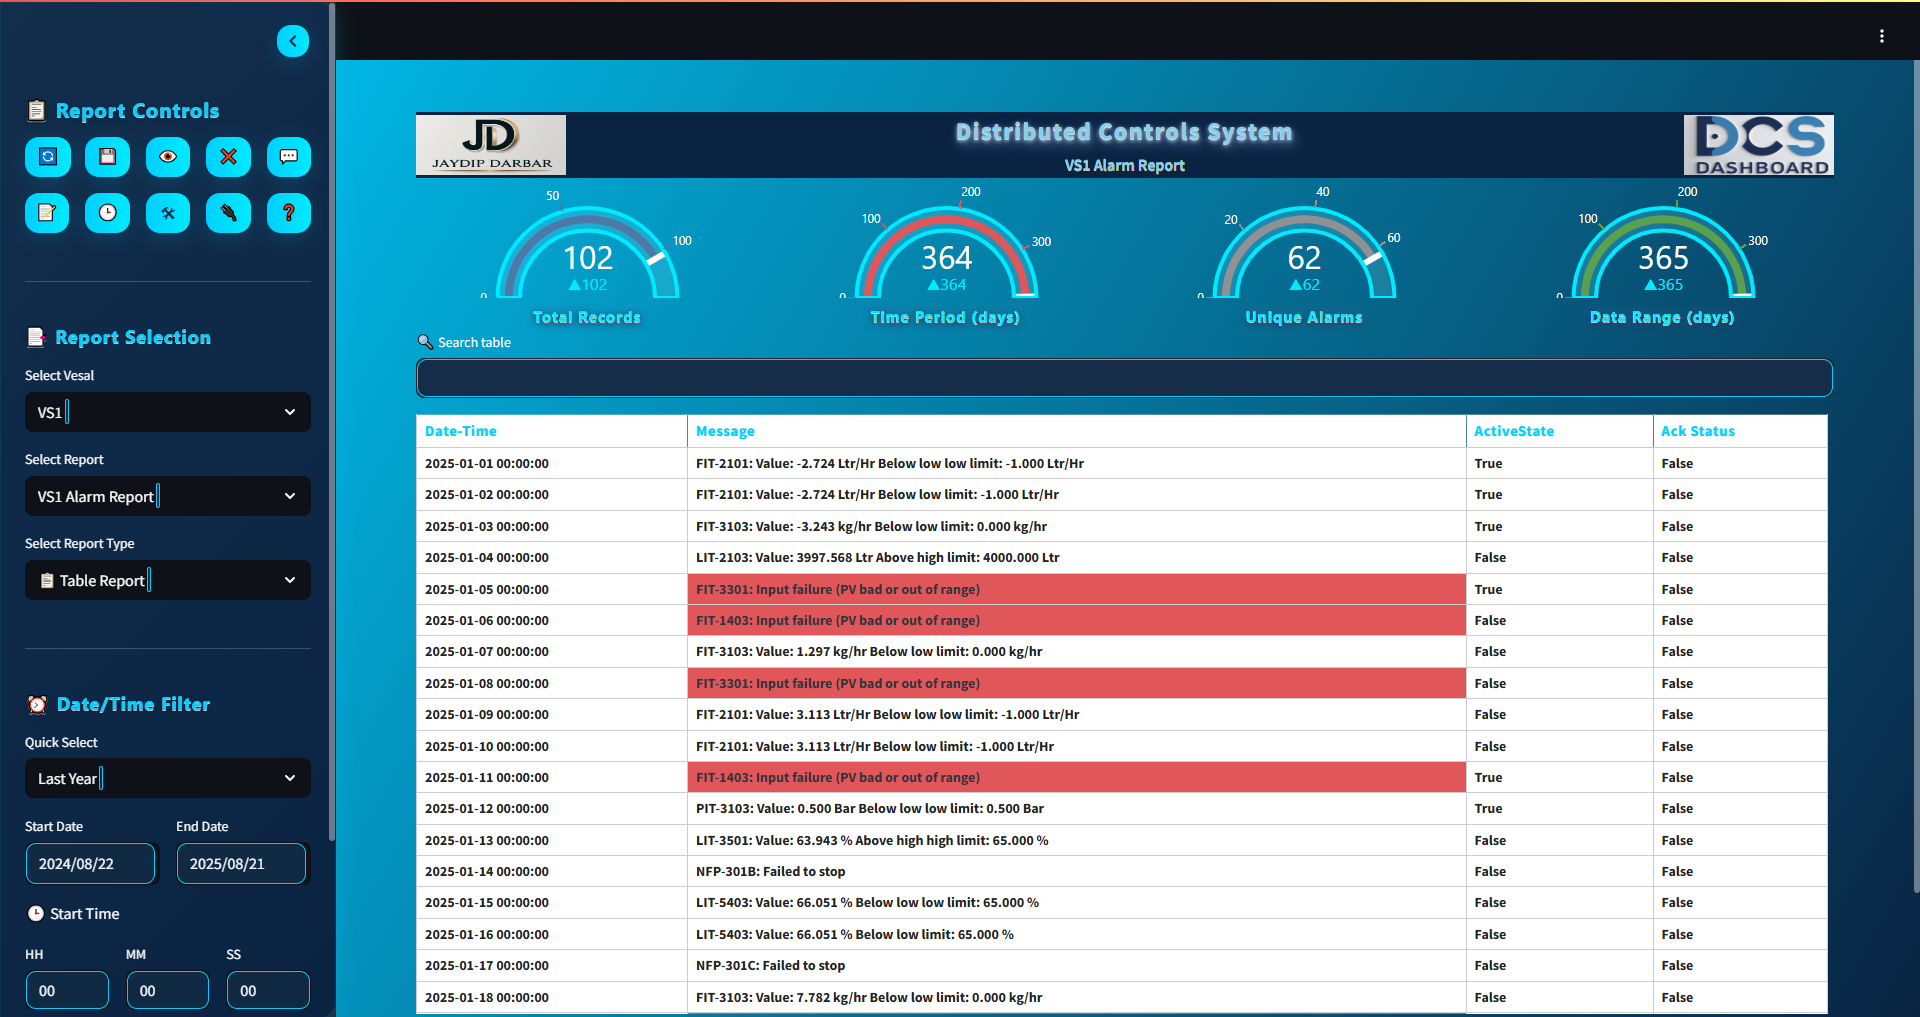
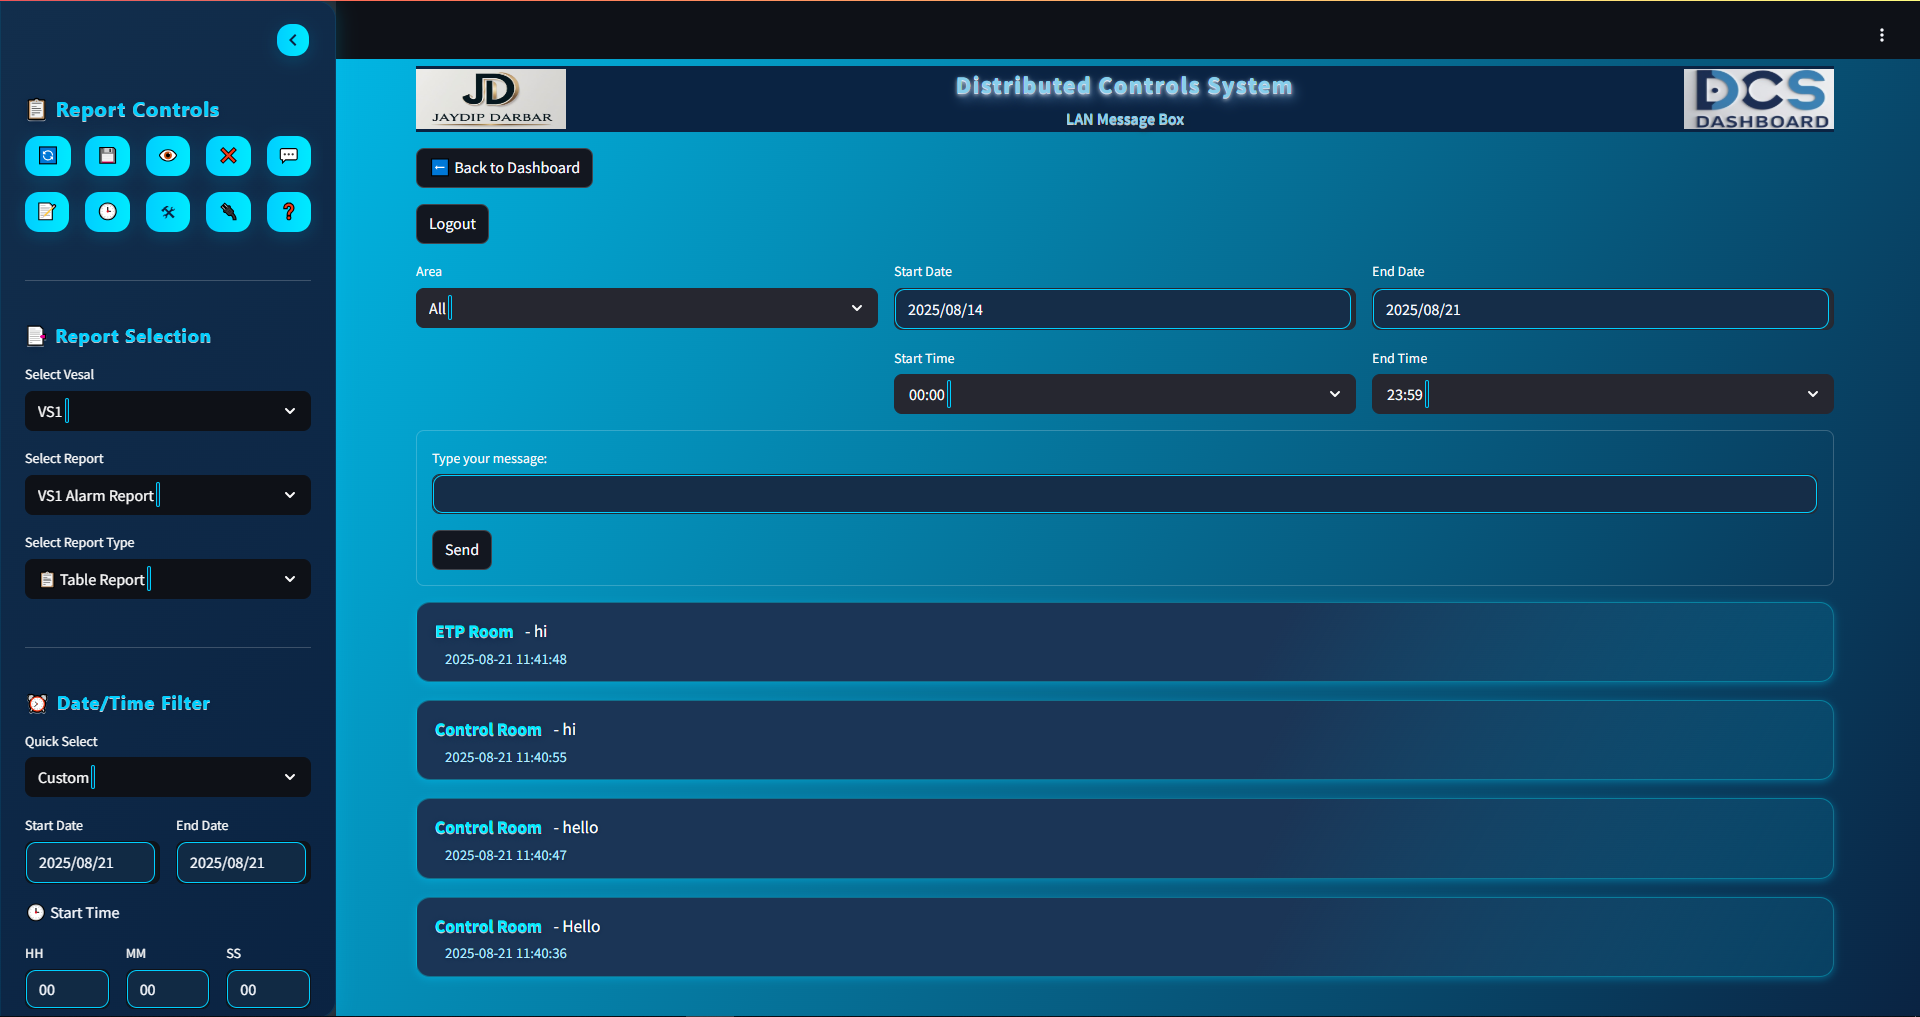
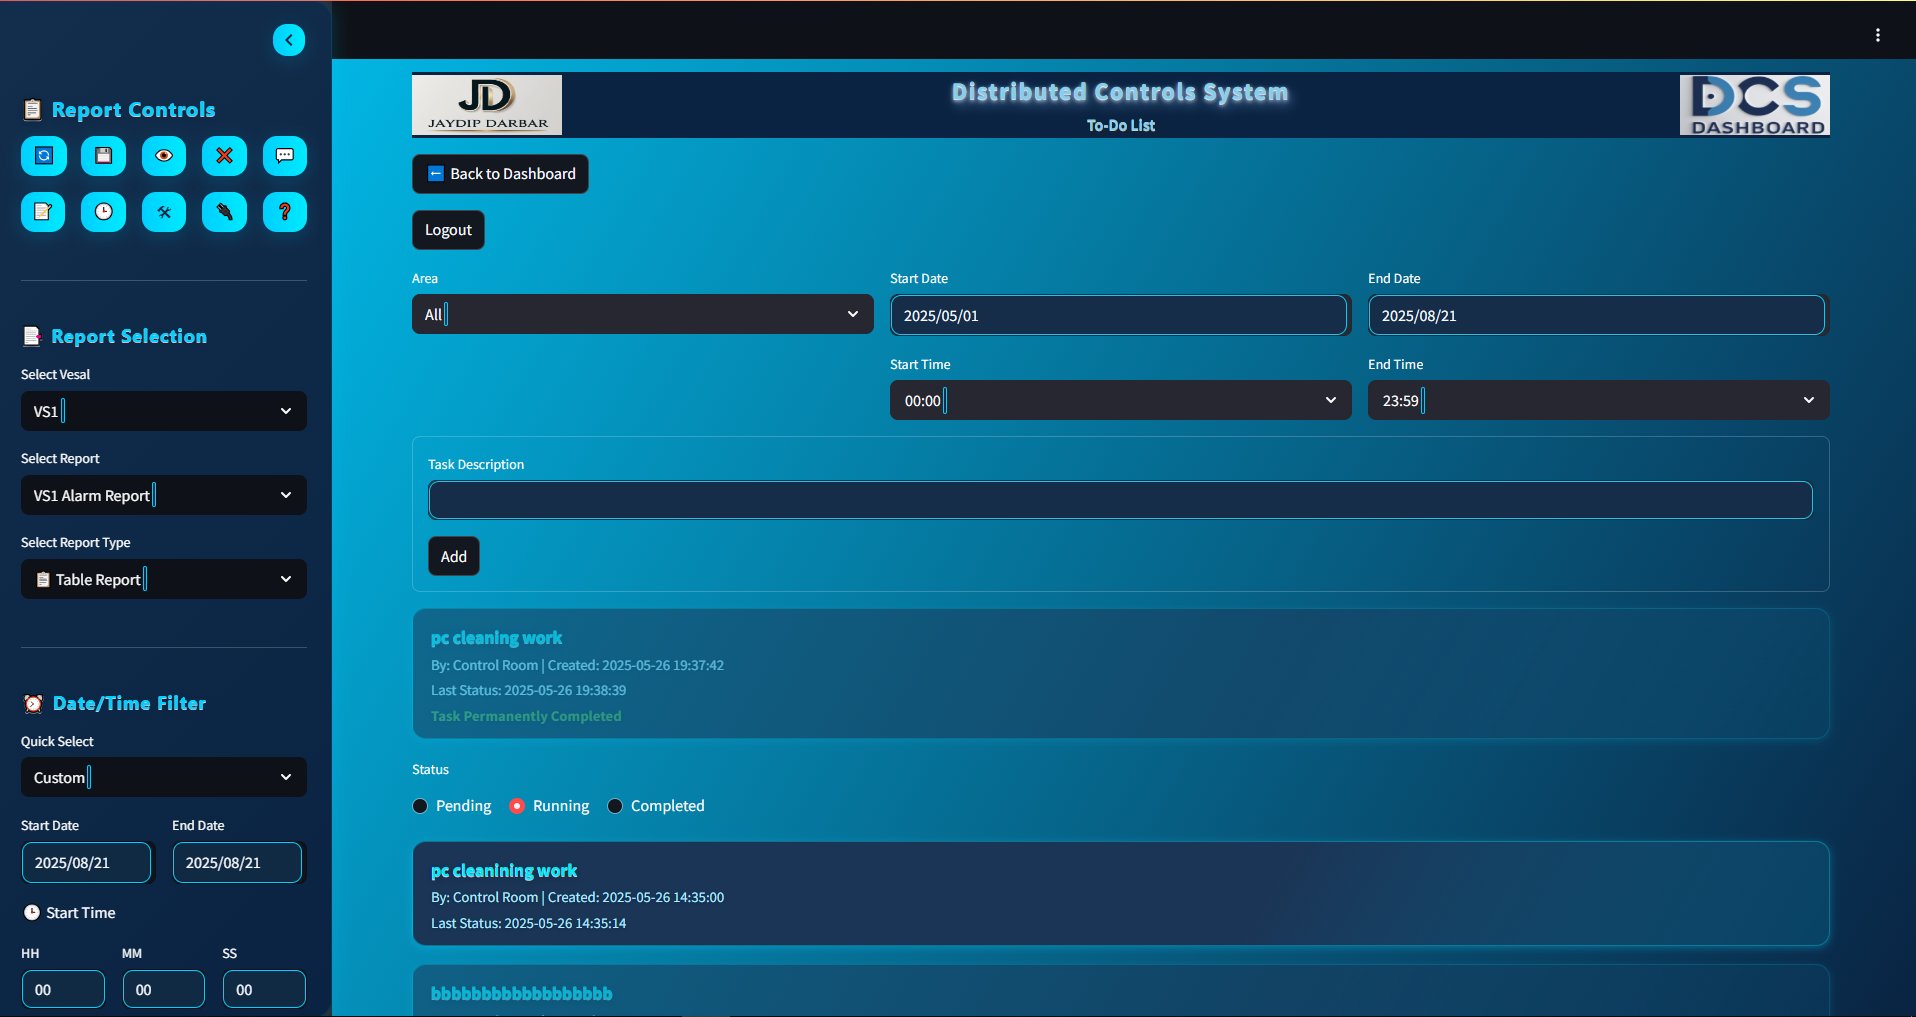
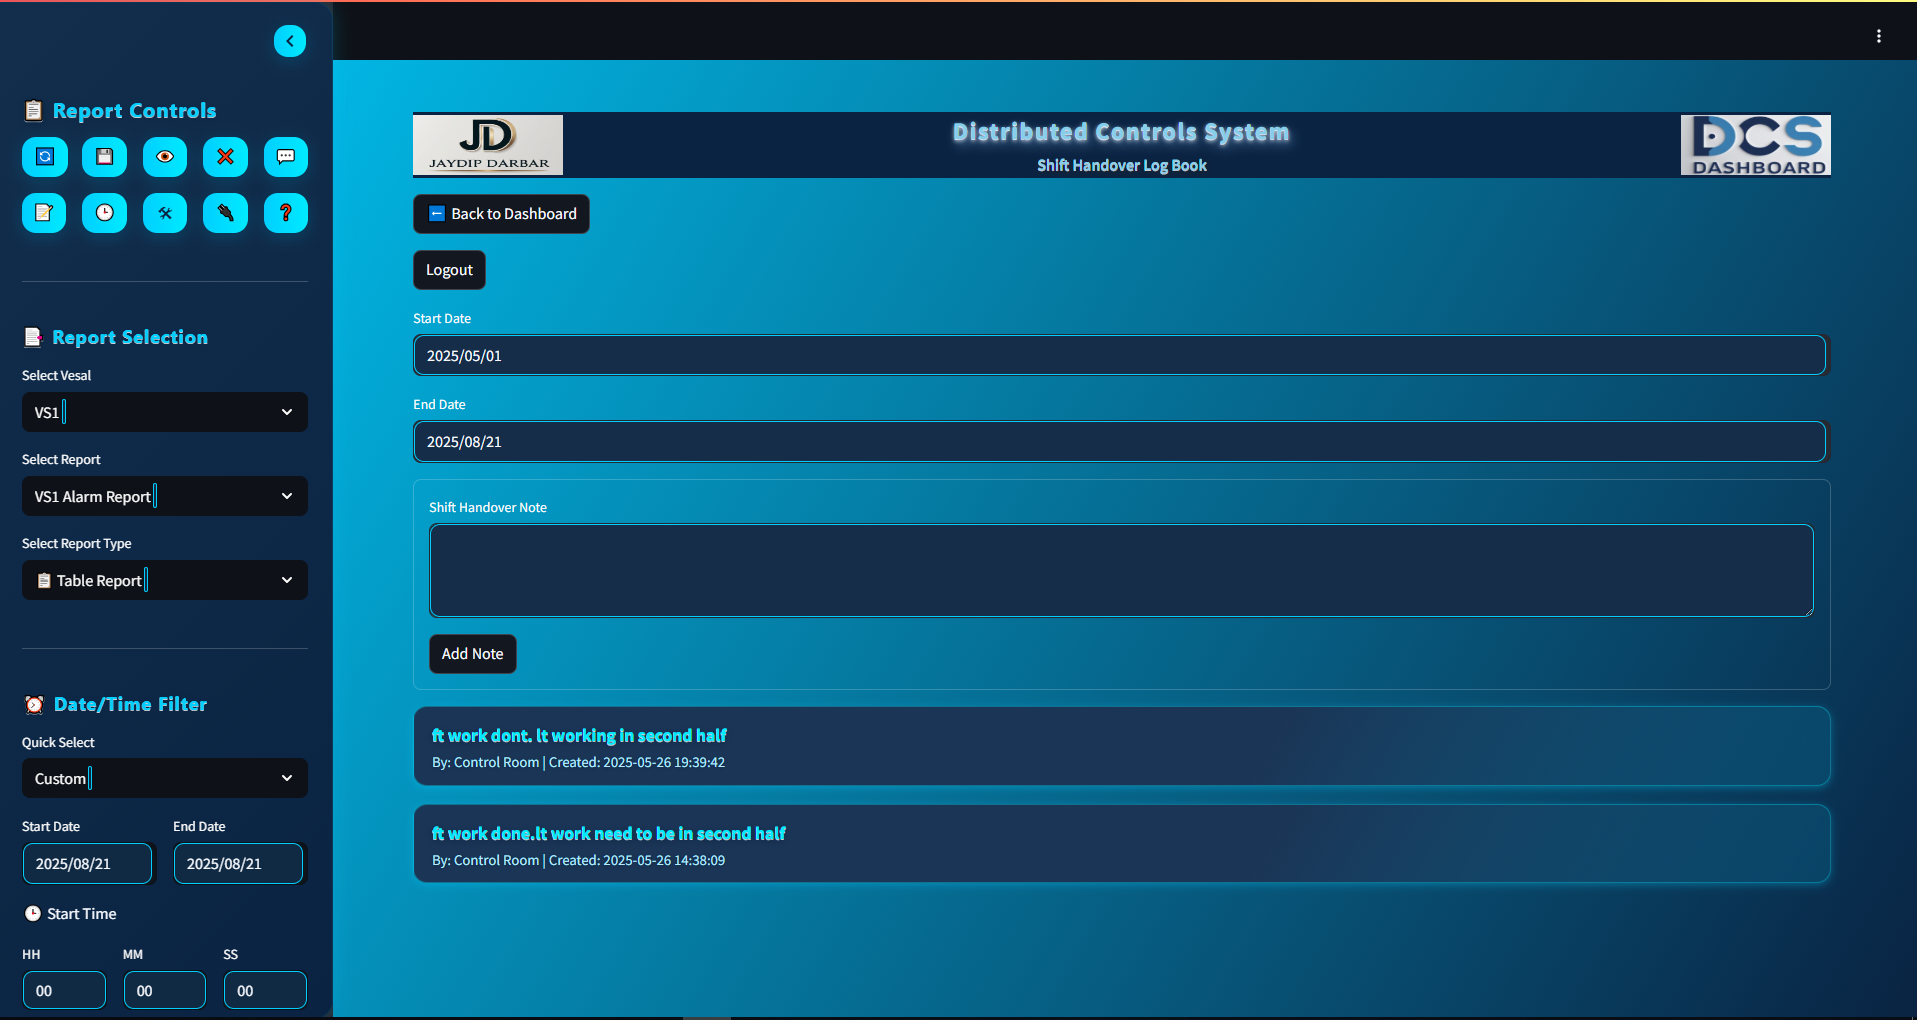
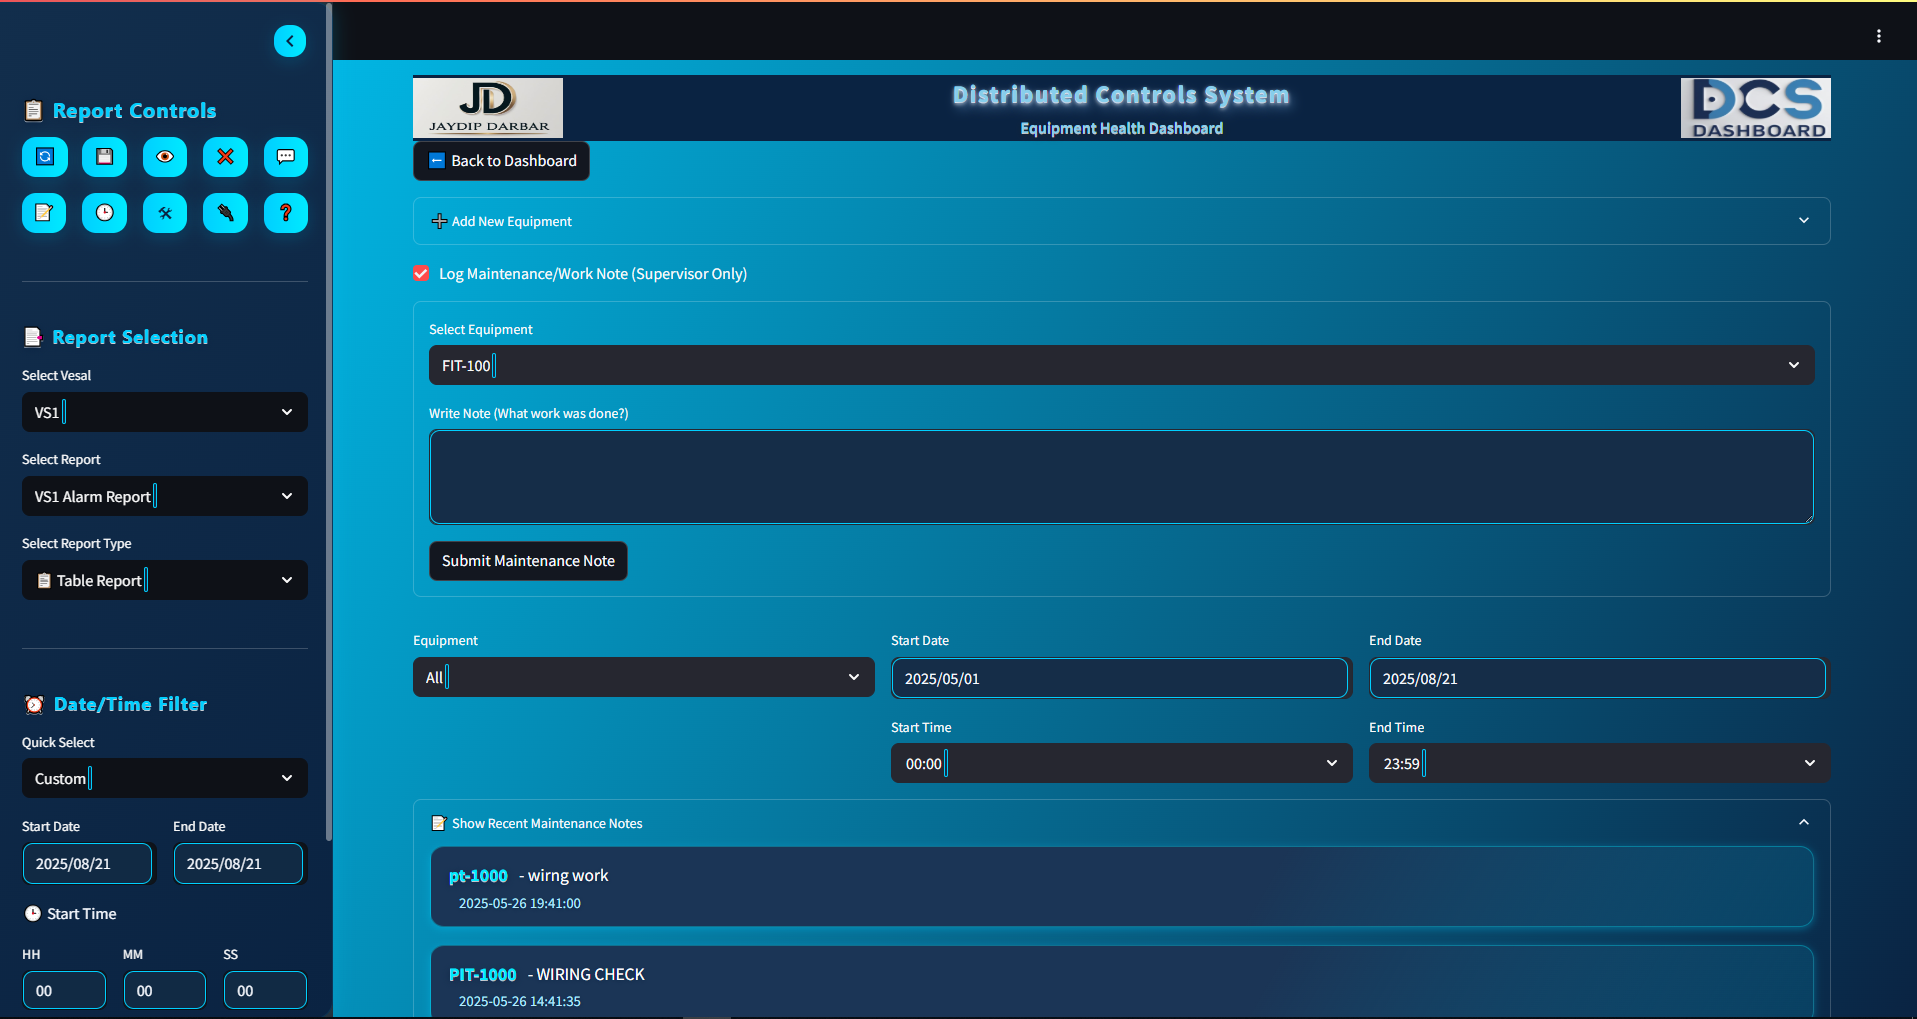
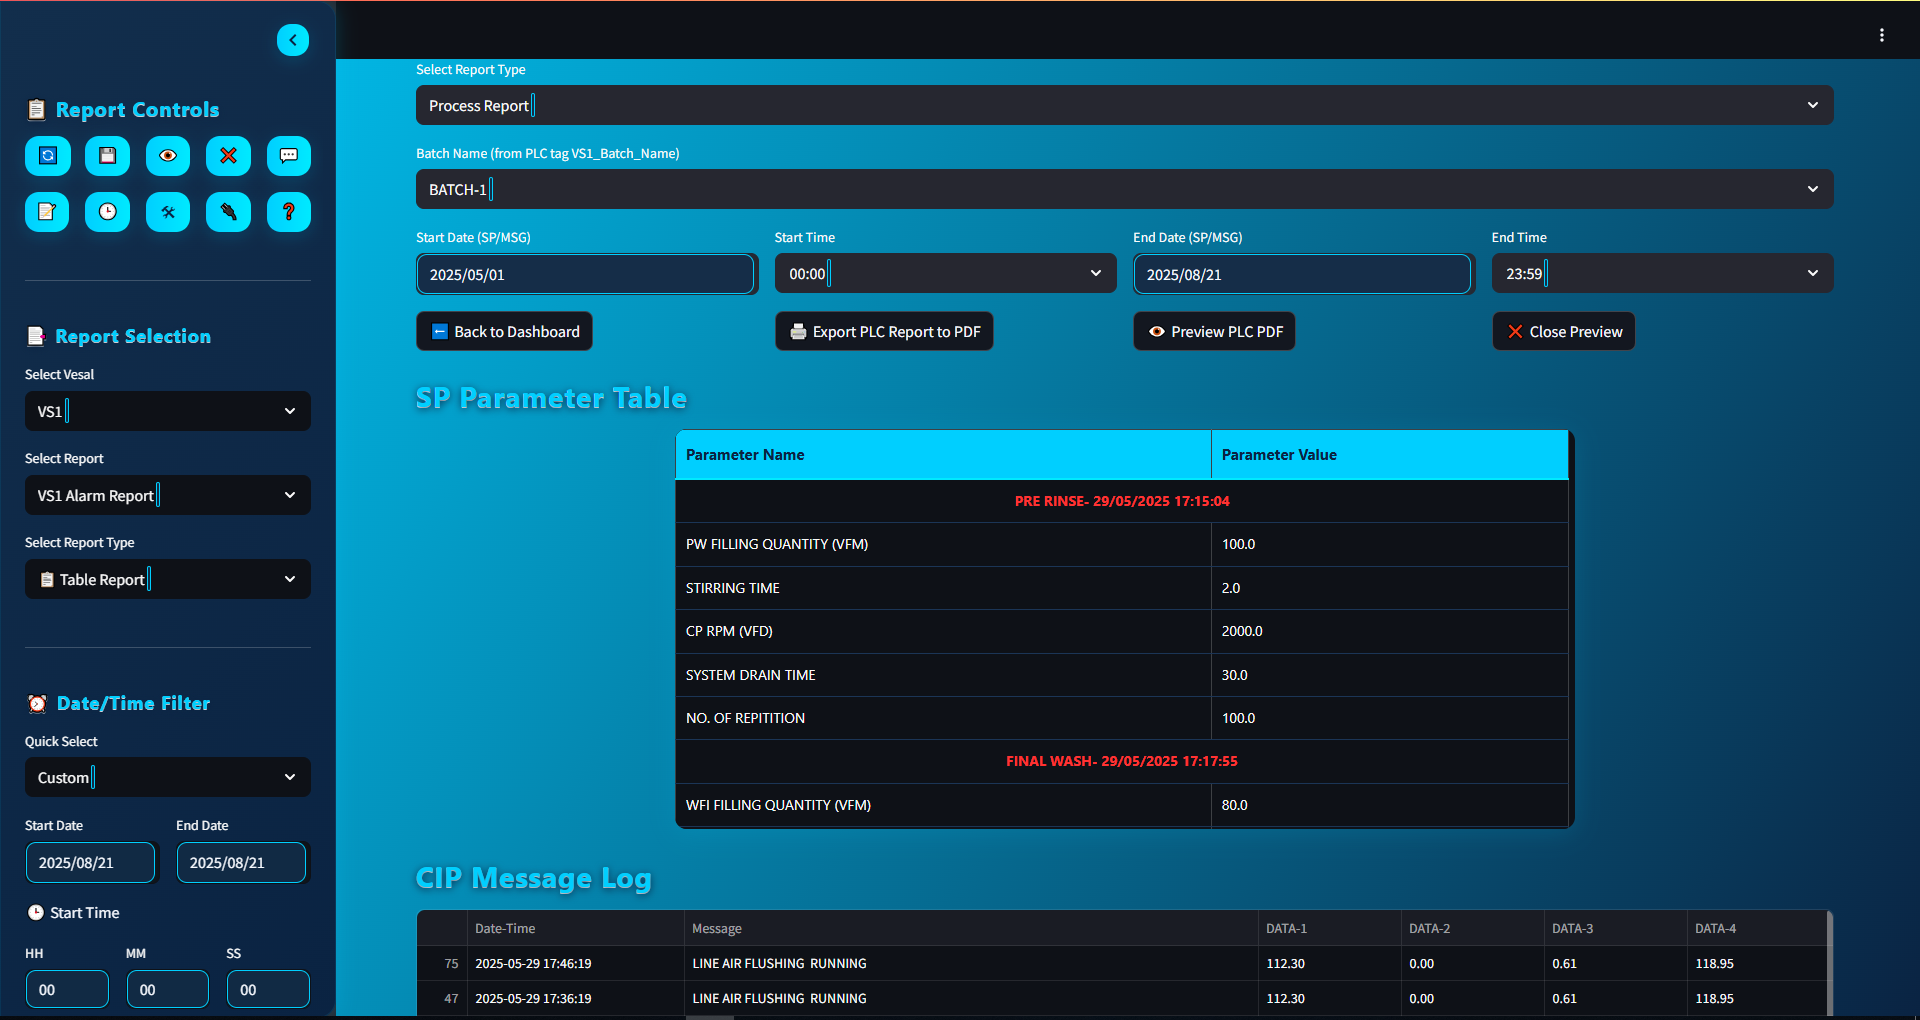
Smart IIoT Dashboard with Streamlit
Purpose: Unify operations, communication, and reporting in one app.
Detailed Architecture:
Streamlit Web App: Sections for Live Data, Maintenance Logs, Chat, Reports
Uses WebSockets for instant updates
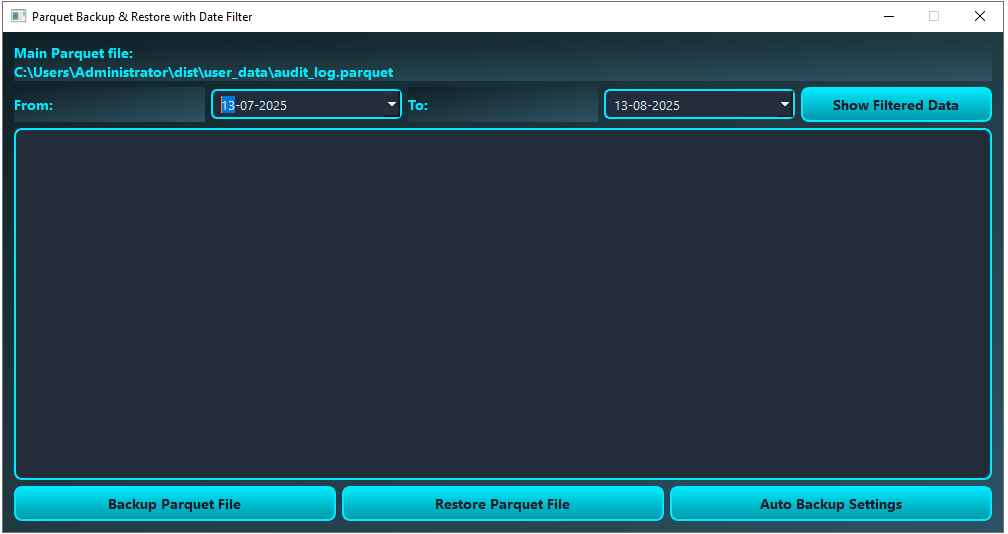
Data Storage: Parquet for high-speed read/write, historical archiving in SQL Server
Built-in Chat: LAN-based, no internet dependency, messages stored in Parquet
Reports: PDF generation with ReportLab/WeasyPrint, auto-send via email
Why this matters: Integrates data + communication + reporting into one lightweight tool — great for small to mid-size plants.
Challenges & Mitigations:
Browser performance → Paginate large datasets.
Chat spam → Role-based chat permissions.
File storage → Clean-up scripts to prevent disk bloat.
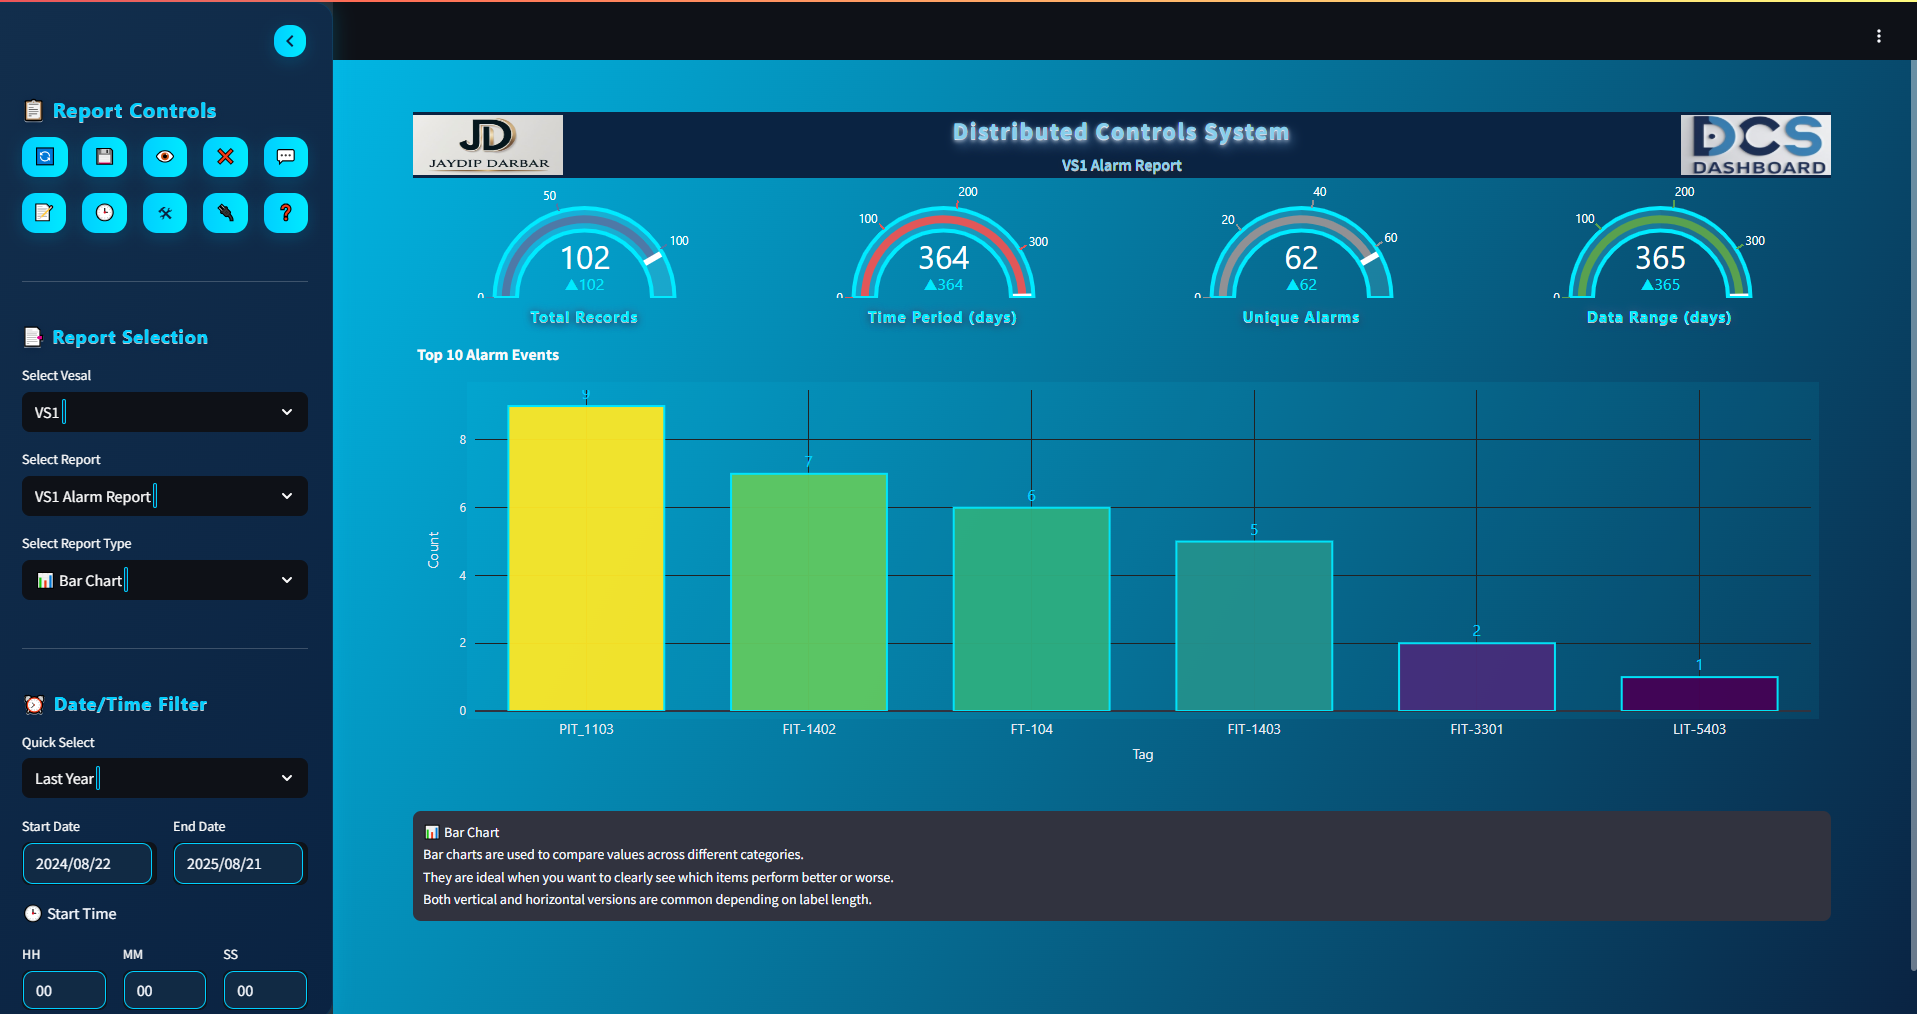
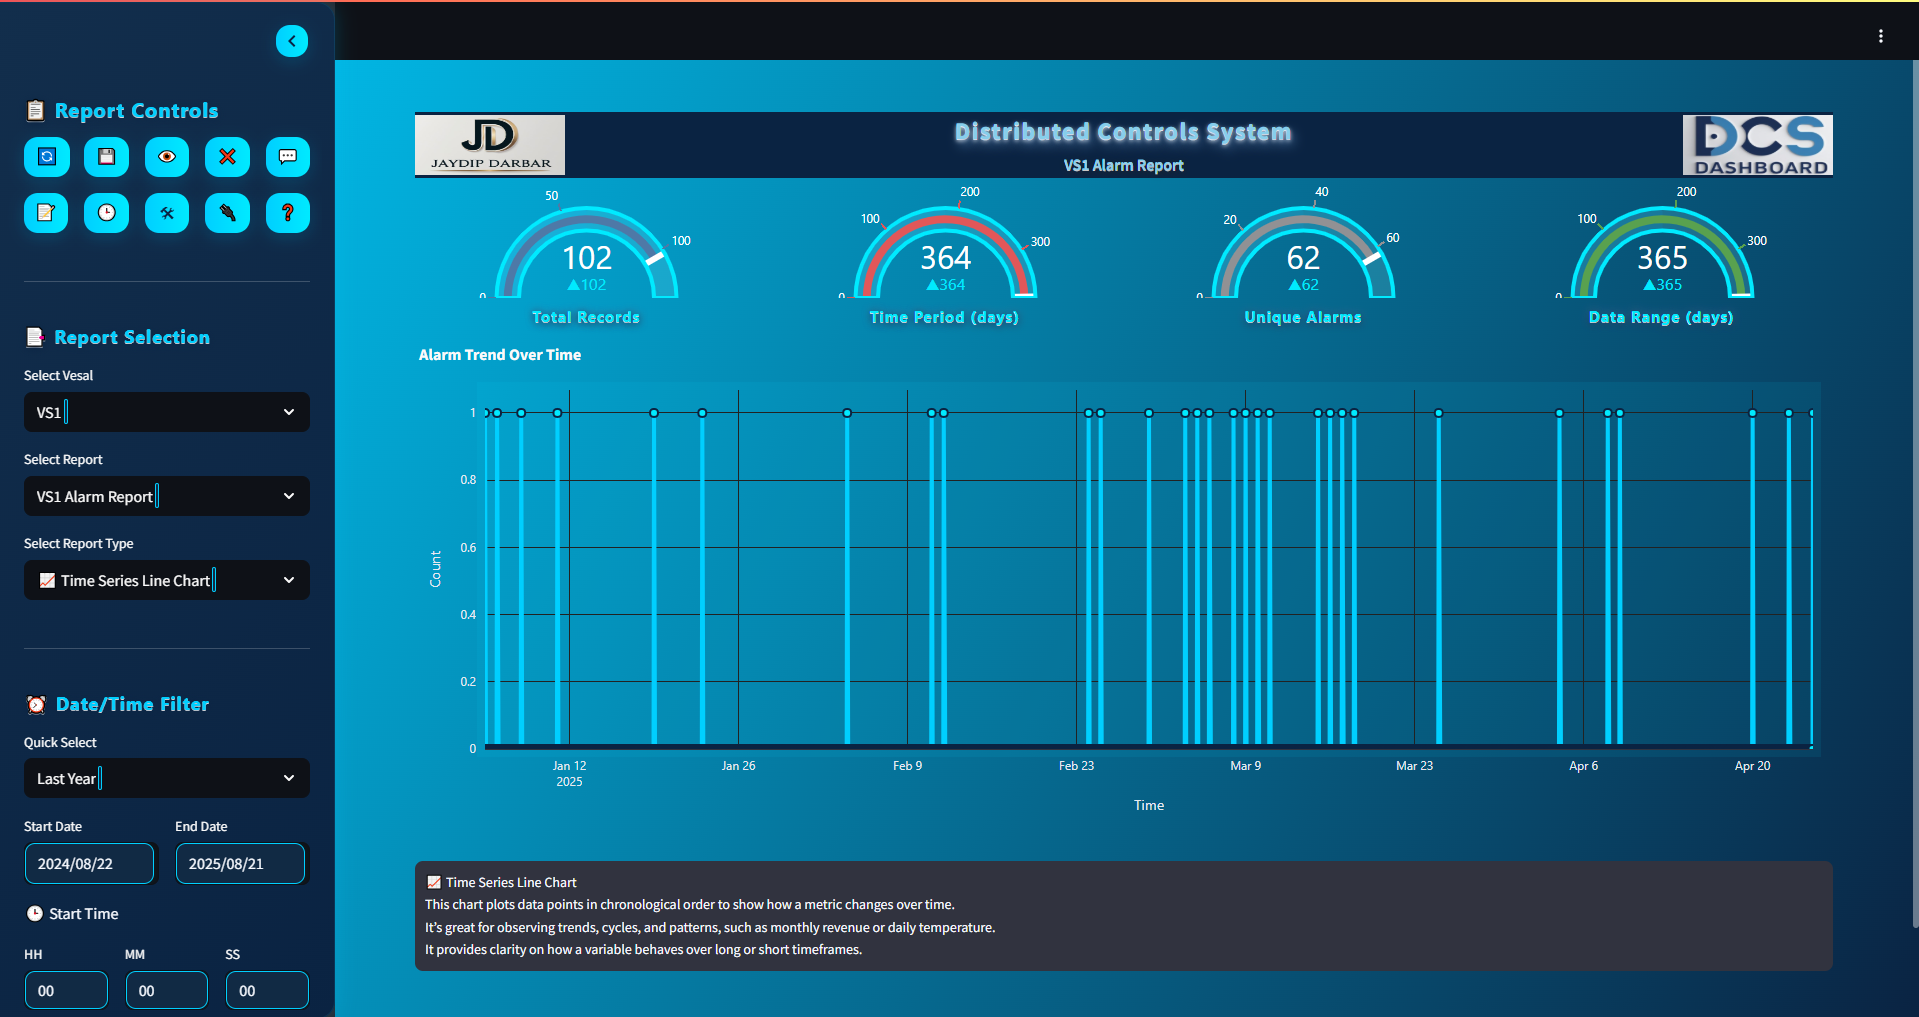
Centralized Grafana Dashboard
Purpose: Give global visibility of plant performance without installing dashboards locally.
Detailed Architecture:
Data Sources:
SQL Server (production data, alarms)
InfluxDB (time-series process data)
Grafana:
Multi-database queries
Alerting (email, Slack, Teams)
Secure Access:
Nginx reverse proxy with HTTPS
LDAP/SSO for corporate authentication
Why this matters: Grafana provides vendor-neutral visualization — all plants, all protocols, one dashboard.
Challenges & Mitigations:
DB query load → Use aggregated tables or continuous queries.
Internet security → Restrict by IP or VPN for external access.
Time zone differences → Use Grafana’s built-in time zone selector.
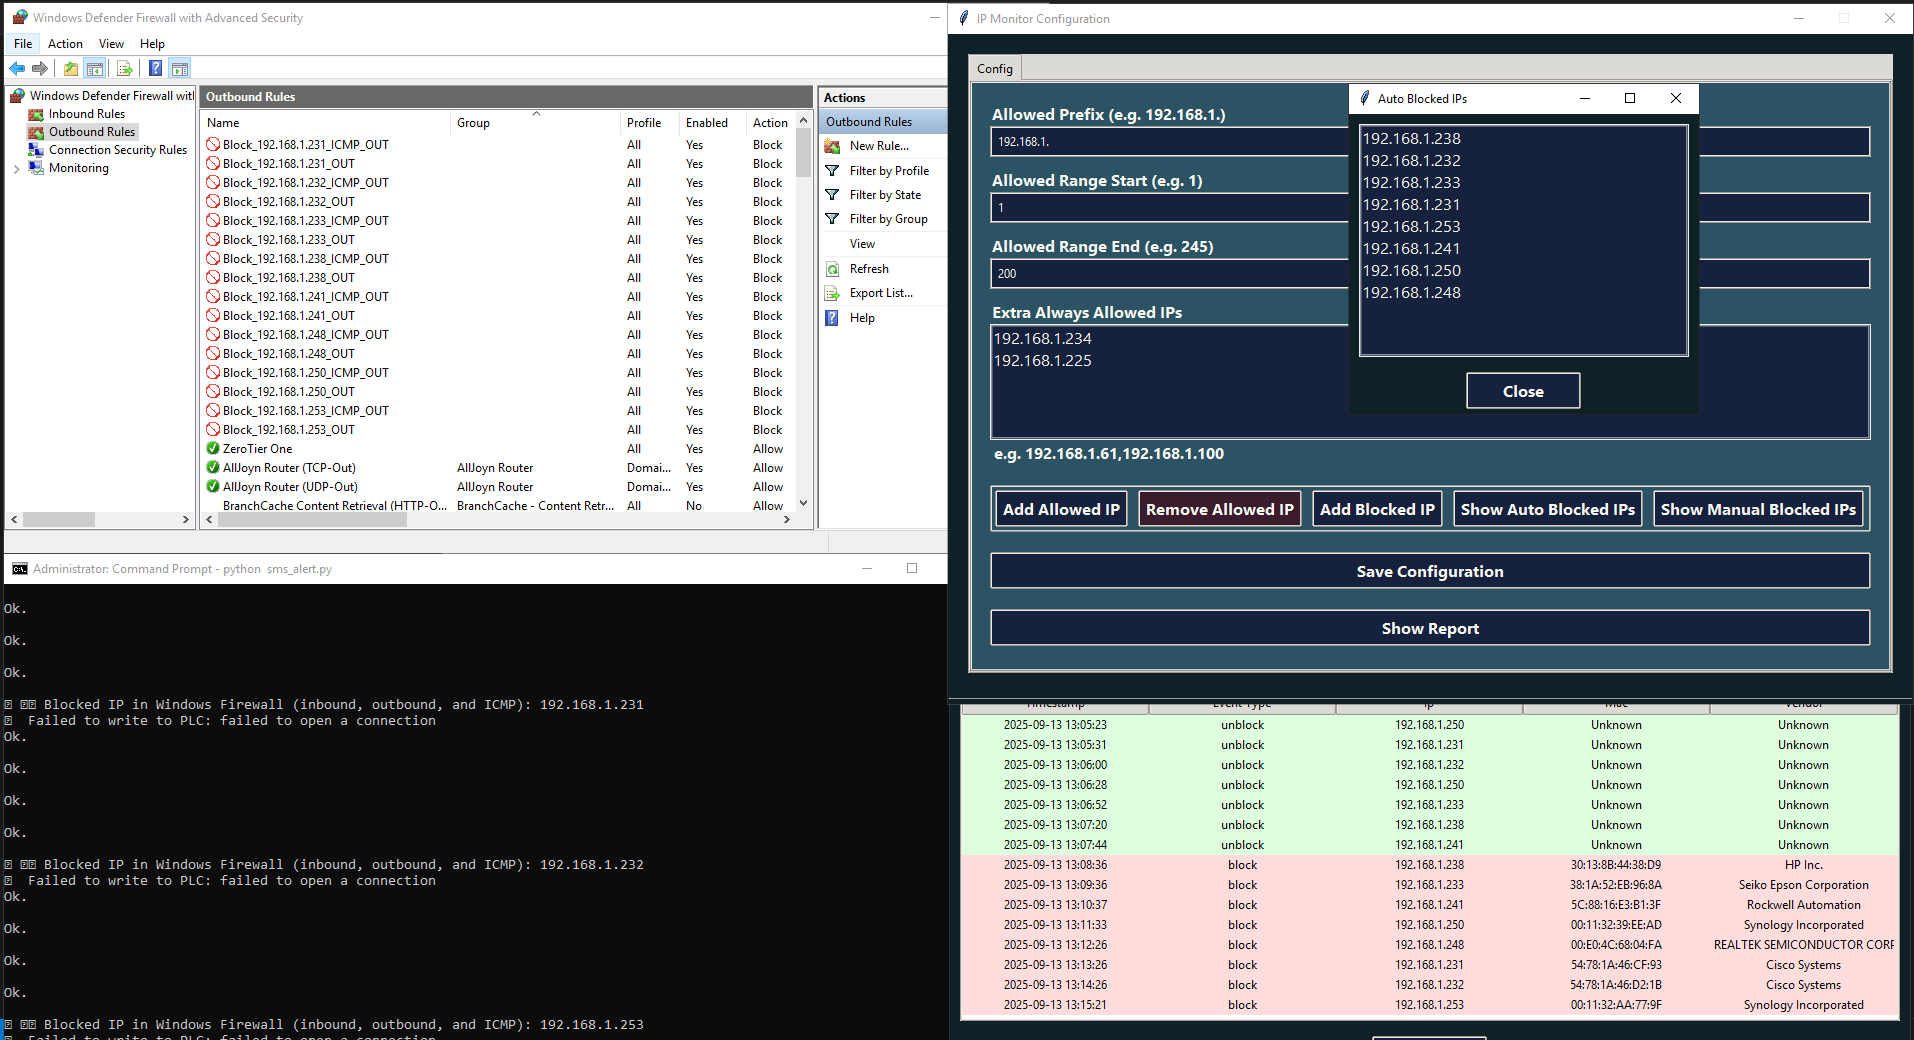
IP Monitor & Auto-Blocker
Goal: Secure a specific device (server, SCADA PC, or engineering workstation) by automatically blocking unauthorized IPs and providing a real-time view of network activity.
Features:
Monitors network traffic (ARP + ICMP) in real time
Auto-blocks unauthorized IPs via Windows Firewall
Manual block/unblock controls with persistent rules
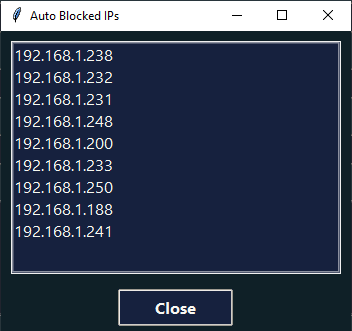
Shows auto-blocked & manual-blocked IPs in separate views
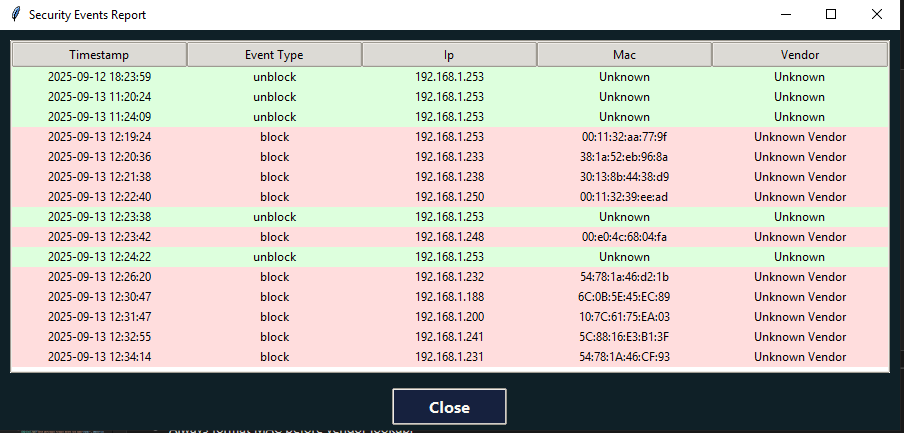
Logs all events (timestamp, IP, MAC, vendor, action)
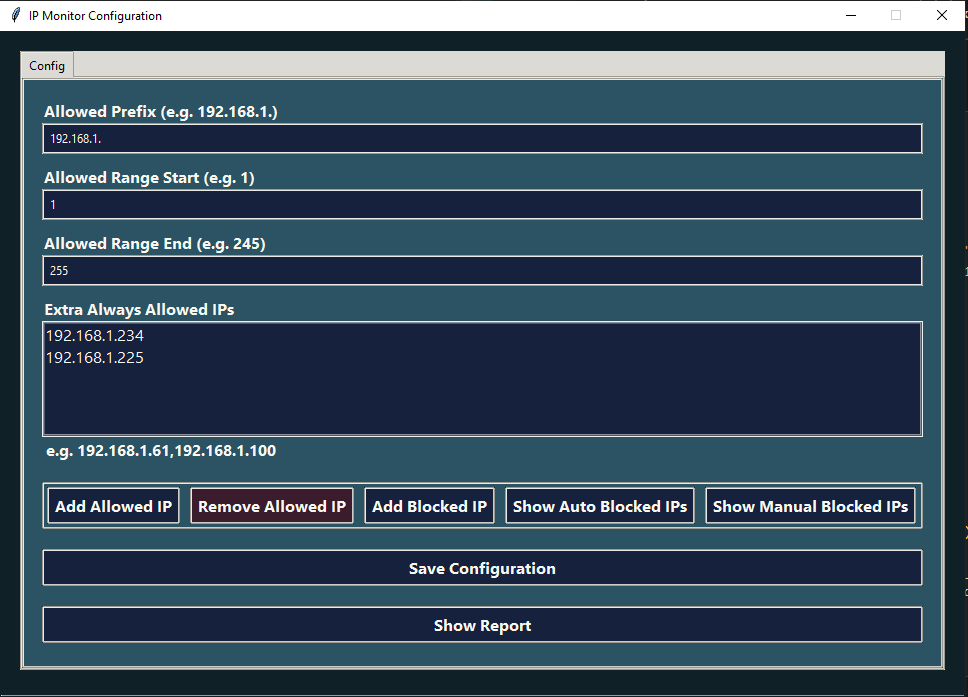
Allows configuration of allowed IP ranges & always-allowed IPs
Supports alerts (Telegram / PLC write mode)
Provides a report viewer for security events
Where It Runs: Installed on a server, SCADA PC, or any Windows host that needs to be protected. Protects only the machine where it runs.
Tech Stack: Python (Tkinter, Scapy), Windows Firewall automation, JSON for configs & logs
📚 Project Case Studies
Cloud-Connected PLC Data Pipeline
Problem:
No real-time visibility of plant data
Operators blind to remote production issues
Delayed decision-making due to batch-based reporting
Solution:
Node-RED gateway for collecting PLC data
Streaming via MQTT → Cloud
Historical logging in SQL Server
Interactive live dashboards for operators
Results:
24/7 remote access to plant data
Improved uptime and proactive troubleshooting
Faster decision-making → reduced downtime
Tech Stack: Node-RED, MQTT, SQL Server
High-Speed Kafka Streaming for Smart Factory
Problem:
High-frequency machine data overwhelmed traditional databases
Data loss during heavy loads
Lack of real-time anomaly detection
Solution:
Apache Kafka for distributed streaming
Partitioned topics for scalability
AI/ML models consuming Kafka topics for predictive maintenance
Results:
Handled millions of events per second
Zero data loss, high reliability
Early detection of equipment failures → reduced costs
Tech Stack: Apache Kafka, ML Models, Python Consumers
Modbus-Enabled Direct Machine Monitoring
Problem:
Legacy machines lacked smart connectivity
Operators relied on manual checks
No central monitoring system
Solution:
Direct Modbus TCP/IP polling from PLCs
Real-time dashboard showing machine OEE
Historical logging in time-series storage
Results:
Reduced manual intervention
Improved equipment utilization
Lower downtime through proactive alerts
Tech Stack: Modbus TCP/IP, SCADA Dashboard, Time-Series DB
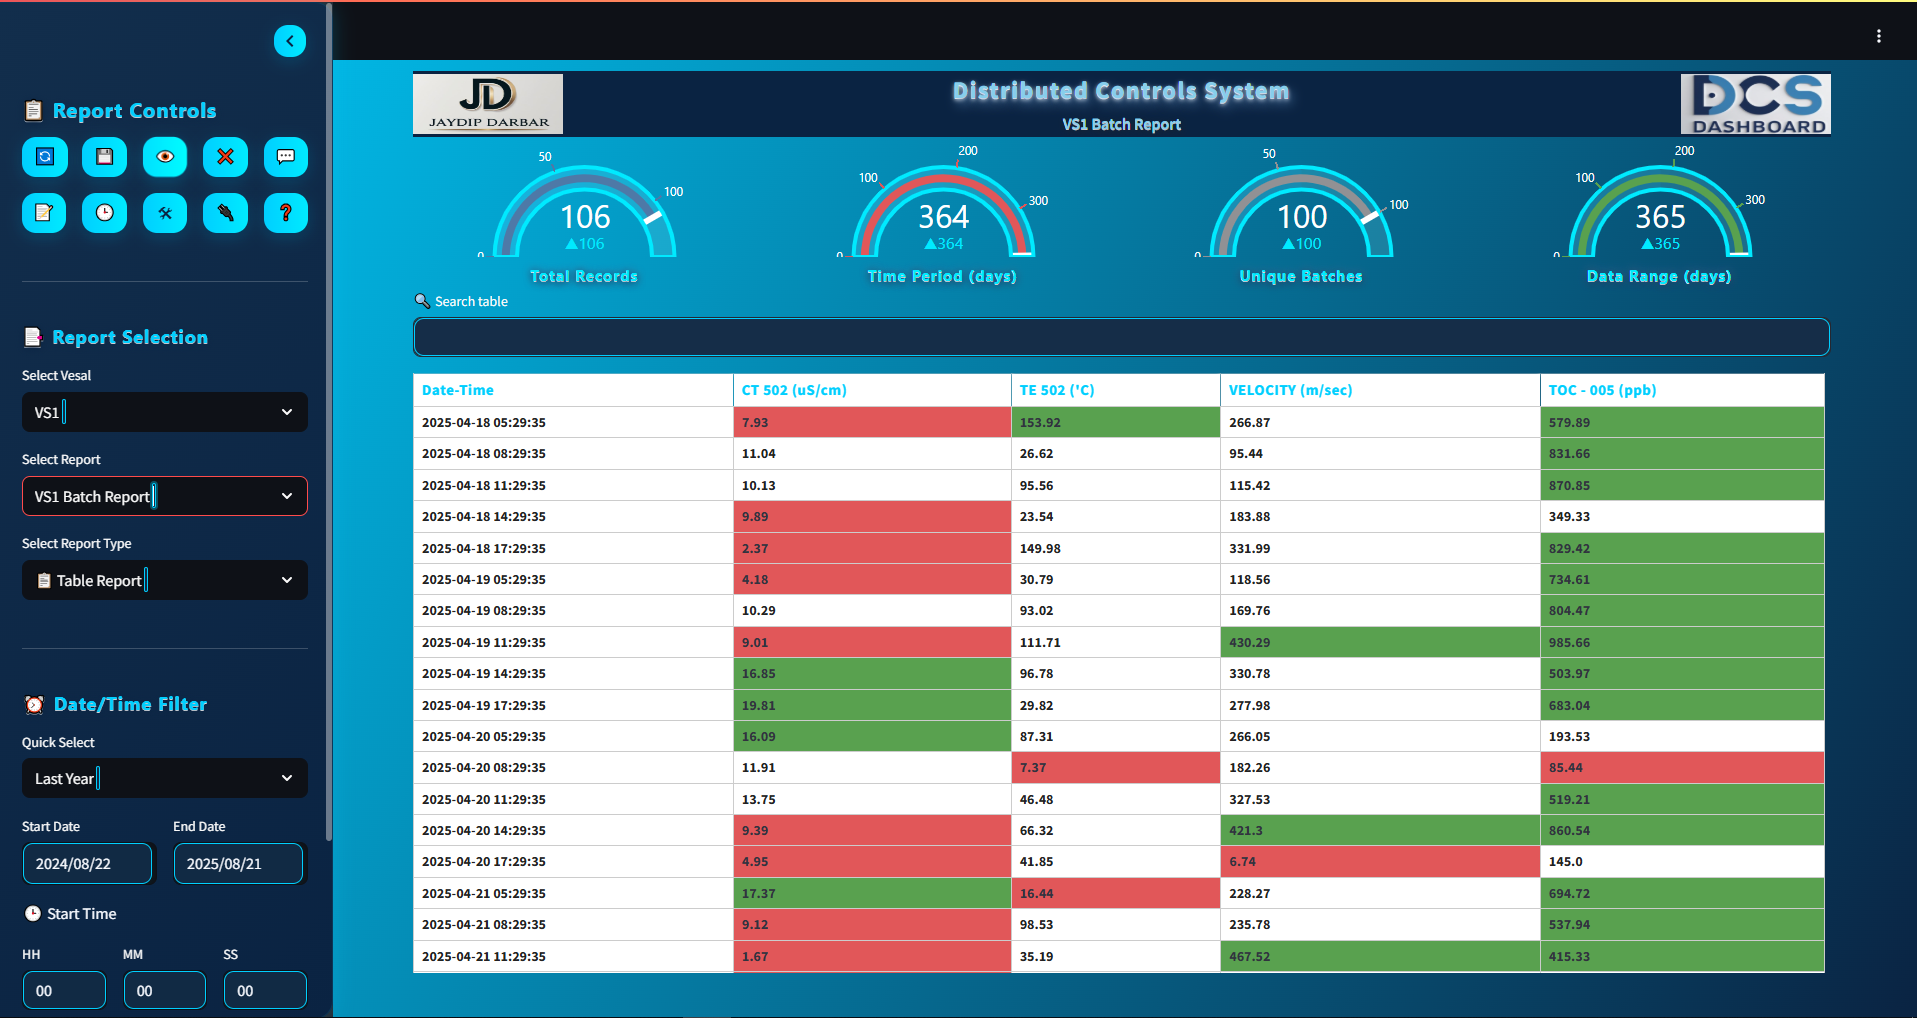
Python-Based User Management for Smart Factory Apps
Problem:
Multiple apps had inconsistent logins
No role-based access control
Security risks from weak authentication
Solution:
Centralized Python authentication service
Role-based access management
Integration with industrial apps (Batch, Alarm, Reports)
In flat industrial networks, any device can reach critical assets, creating security risks. I built a Python-based IP Monitor & Auto-Blocker to protect a key server by automatically blocking unauthorized IPs and alerting operators.
Problem: No centralized firewall, need to block unknown IPs, alert operators, and provide easy manual controls.
Solution:
Real-time ARP & ICMP monitoring
Auto-block/unblock via Windows Firewall
Manual block/unblock with persistent rules
Alerts via Telegram or PLC
Operator-friendly GUI
Key Features:
Host-level protection
Dynamic firewall rules
Event logging & audit trail
Color-coded report viewer
Tech Stack: Python, Tkinter, Scapy, Windows Firewall, JSON